NXSBTC trade ideas

A trading opportunity to buy in NXSBTCTechnical analysis:
. Nexus/Bitcoin is in a range bound and the beginning of uptrend is expected.
. The price is above the 21-Day WEMA which acts as a dynamic support.
. The RSI is at 56.
Trading suggestion:
. There is a possibility of temporary retracement to suggested support zone (0.00009200 to 0.00008100). if so, traders can set orders based on Price Action and expect to reach short-term targets.
Beginning of entry zone (0.00009200)
Ending of entry zone (0.00008100)
Entry signal:
Signal to enter the market occurs when the price comes to " Buy zone " then forms one of the reversal patterns, whether " Bullish Engulfing ", " Hammer " or " Valley " in other words,
NO entry signal when the price comes to the zone BUT after any of the reversal patterns is formed in the zone.
To learn more about " Entry signal " and the special version of our " Price Action " strategy FOLLOW our lessons:
Take Profits:
TP1= @ 0.00011300
TP2= @ 0.00013350
TP3= @ 0.00015900
TP4= @ 0.00018300
TP5= @ 0.00022100
TP6= @ 0.00024600
TP7= @ 0.00036600
TP8= @ 0.00046300
TP9= @ 0.00055900
TP10= @ 0.00069700
TP11= @ 0.00087220
TP12= Free


Nexus (NXSBTC) Completes A Cycle (1250%+ On The Way Up)The NXSBTC chart is starting to look beautiful for a long term trade... We are about to complete a cycle.
We have a high volume inverted hammer candlestick.
The RSI shows massively oversold.
Bullish divergence on the MACD.
100% of gains removed from last bull run.
1-2 months for massive bullish action.
1200%+ Profits Potential (PP) to All Time High.
Get ready...
Note: This is a FREE analysis for learning and entertainment purposes. If you enjoyed the read please hit LIKE...
YOUR SUPPORT IS TRULY APPRECIATED!
Namaste.


NEXUS LONG IDEANXS LONG IDEA
Check my fb: www.facebook.com
Free Discord Channel: discordapp.com
Twitter: twitter.com


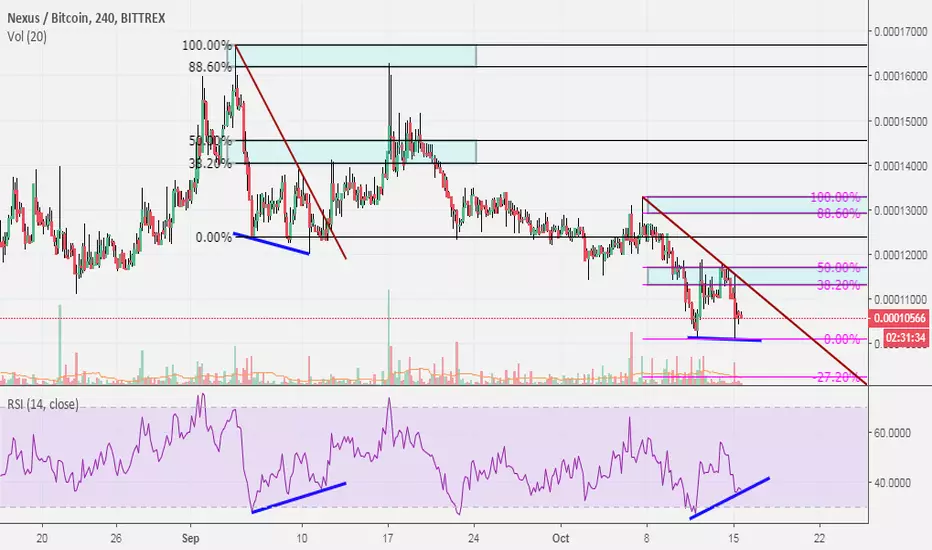
There is a possibility for the beginning of an uptrend in NXSBTCTechnical analysis:
. NEXUS/BITCOIN is in a range bound and the beginning of uptrend is expected.
. The price is below the 21-Day WEMA which acts as a dynamic resistance.
. The RSI is at 44.
. While the price downtrend in the daily chart is not broken, bearish wave in price would continue.
Trading suggestion:
. There is a possibility of temporary retracement to suggested support zone (0.00010600 to 0.00009900). if so, traders can set orders based on Price Action and expect to reach short-term targets.
Beginning of entry zone (0.00010600)
Ending of entry zone (0.00009900)
Entry signal:
Signal to enter the market occurs when the price comes to " Buy zone " then forms one of the reversal patterns, whether " Bullish Engulfing ", " Hammer " or " Valley " in other words,
NO entry signal when the price comes to the zone BUT after any of the reversal patterns is formed in the zone.
To learn more about " Entry signal " and the special version of our " Price Action " strategy FOLLOW our lessons:
Take Profits:
TP1= @ 0.00015900
TP2= @ 0.00018300
TP3= @ 0.00022100
TP4= @ 0.00027700
TP5= @ 0.00038700
TP6= @ 0.00047600
TP7= @ 0.00056600
TP8= @ 0.00069200
TP9= @ 0.00085400
TP10= Free


NXS/BTC PairHere's a possible projection for NXS/BTC pair. waiting for some confirmations from indicators and if the pattern will be completed.

Nexus - The end of one cycle and beginning of another!I think we can expect to see another breakout soon for Nexus.
The end of a macro cycle going all the way back to January 2017 is closing within the next few months - and as a result a new one begins.
Energy has no point of origin - but it does have inflection with respect to its ongoing cycles.
Might be good to get some at the bottom so you can sell at the top - LIKE A BOSS!
Stay Cryptic Ya'll.

Still holding, keep adding. Hey guys, i hit my magic number thank you all for selling this so cheap to me.
I hope it does not get any lower at this point heh.
Nexus is like the definition of the underdog of crypto. I can;t wait for the day that they launch their rockets with micro satellites.
Next fractal is in December, so it is probable that NOV is going to be big on accumilation and flat territory just like it was at point 4, a year ago.
Good luck everyone ;)
**LEGENDS**
BLUE = Bear/Resistance
Yellow = Bull/ Support
~Explore the chart for possible scenarios of price actions - use zoom and scroll for better view.~
/*This information is not a recommendation to buy or sell. It is to be used for educational purposes only.*/
If you want your coin to be analysed, JUST ask.
If you got a question, ASK away!
And please keep those Stop losses in place!
Fractal dates are moments of interest, where price and time collide to create oscillation - vertical lines!
Thank you,
Ajion

NXS/BTC - 6R Trade on Daily TF.Strong Historical Support + Bullish Divergence on RSI on Daily TF. Exceptionally good R:R

NXSBTC - There Is a Possibility of the Beginning an Uptrend RSI Positive Divergence
fibo-based growth expectation
!!! dynamic resistance for safe entry !!!
‘The Calculator’ - Analysis #13Although many trades could be taken based on the underlying math of ‘The Calculator’, my personal (conservative) trading rules say that it’s NOT about the quantity of trades. It’s about the potential QUALITY of the trade. It’s what I call ‘predictable probability’.
If you find this analysis of any value or merit, please provide a COMMENT and/or a THUMBS UP. Thanks in advance for your follow through.
With all that being said, I am NOT a professional trader. I DO NOT provide investment advice. This content and the data provided in the indicator is based on my live and simulated, personal observations and is intended for educational purposes ONLY. YOU are responsible for ALL your trading decisions and ALL subsequent tax ramifications. Past performance DOES NOT guarantee future results.

Nexus (Midterm) is Ready For the Bull Run...[3X Expected]In this bull season, all the altcoins starts pumping , But NEXUS NXSBTC is not strated yet.
1D Chart looks like Forming a Cup,
From the past history , the prices goes up from the 9800 Satoshi level again & again.
Now the price just bounce back from this level.
So bull run expected.
Technically, Bullish divergence was found , which is a bullish signal.
RSI almost in Oversold zone.
*****If You Like My Ideas,then hit the like button & Follow me for Latest Updates..******
Disclaimer:
I am not a financial advisor. Please do your own due diligence when it comes to investing. Never put in money that you cannot afford to lose.
This information is not a recommendation to buy or sell. It is to be used for educational purposes only.
" Be Happy, Be Disciplined & Keep Smiling "

NXS Trading AdviceBuy Price: Yellow Line
TP: Green Lines
Invest Suggestion: 5-10 Percent
Profit Expectations: 5, 10 or >20 Percent
Just hold and watch. All targets will be reached within 24 to 72 hours as my prediction. But it's recommended to hold it for 6-7 days if any target not reached. Sell when you got some profit. I am sure, you will be get nice profit. Good Luck!
Please like and share this idea.
Thanks for visiting.

There is a possibility for the beginning of an uptrend in NXSBTCTechnical analysis:
. Nexus/Bitcoin is in a range bound and the beginning of uptrend is expected.
.The price is above the 21-Day WEMA which acts as a dynamic support.
. The RSI is at 50.
Trading suggestion:
. There is a possibility of temporary retracement to suggested support zone (0.00013642 to 0.00010182). if so, traders can set orders based on Price Action and expect to reach short-term targets.
Beginning of entry zone (0.00013642)
Ending of entry zone (0.00010182)
Entry signal:
Signal to enter the market occurs when the price comes to "Buy zone" then forms one of the reversal patterns, whether "Bullish Engulfing" , "Hammer" or "Valley" in other words,
NO entry signal when the price comes to the zone BUT after any of the reversal patterns is formed in the zone.
To learn more about "Entry signal" and the special version of our "Price Action" strategy FOLLOW our lessons:
Take Profits:
TP1= @ 0.00016799
TP2= @ 0.00018287
TP3= @ 0.00021931
TP4= @ 0.00028481
TP5= @ 0.00039385
TP6= @ 0.00048141
TP7= @ 0.00056937
TP8= @ 0.00069433
TP9= @ 0.00085432
TP10= Free

$NXS, Lower Low Ahead…
Weekly
Looking at our trend timeframe we see price continuing to respect our downtrend, stochastic rsi showing momentum is heading towards the upside. Will be watching smaller timeframe for entry, lower high formed at 15000 expecting price to continue falling towards our 5000 support zone.
Daily
Shifting over to our pattern timeframe we see a double bottom has formed inside our support zone. Stochastic RSI showing momentum looking to form a higher low and continue towards the upside. A daily close above 13700 activates our trade.

