NXTBTC Falling Wedge Breakout
NXT formed falling wedge during retracement to lovest level and going to breakout.
Only one target in that pattern
TP 4125
SL 3450
NXTBTC trade ideas

The NXT trade! NXTBTC Long opportunity Hello fellow traders.
This is our NXTBTC idea! The price has recently skyrocketed against BTC, and is starting to pullback creating a bullish flag. We're planning to go long on the break of said flag with the stops, and take profits listed above.
Planning to ride the trend for as long as we can! The risk reward is pretty good, so its worth a shot! **So keep in mind we're not currently in the position yet just merely on the sidelines, observing **
We've also observered a MACD crossover and RSI breakout! If you have any questions or concerns, feel free to let us know! We appreciate all and any feedback. As always, thank you for taking the time to check out our post!


Another Head and Shoulder on $NXTstill learning but what i can see from here is that $NXT is forming a head and shoulder and the prices should come down a bit

Probably H&S formation.1.After a 3 days of rally, it seems to cool down a bit.
2.Volume decreased significantly.
3.Correction coming on 1D chart

NXT/BTC Correction Wave Prediction (4H Candles)I'm a bit torn on if this will be a normal ABC Correction, or if this was wave 5, and a larger correction will take place like the last large uptrend where it dropped to around 2000 sats after hitting ~4100 sats. I know this is a bit cluttered, but I've tried to see where on the fib the different waves have fallen in the past, and there appear to be some consistency between the different ones. If this isn't the 5th wave, (which it appears to be), then you can attempt to buy A, sell B, buy C, then ride it up. If this was the 5th wave, then that'd put C around 2000-2200 sats before the rockets take off.
I went all in on NXT a week ago at 1800 and doubled my money. I've sold it and I have two buy orders in right now that are a bit conservative, and not really my "targets" for this chart since overall I feel like this will hit minimum 7500+ sats before Dec 25th with the airdrop etc, and I don't want to blotch this like I did EMC2 a few weeks ago and forgot to buy back in after my first target I had on the chart I posted. As of now, I have a buy order at 3254 sats and another at 2868. A buy back at either of these nets me more coins, so I'm fine if I don't hit it perfect and have to ride it down a bit further. If it looks like it is going towards 2k-2200 I'll plan to stop loss and buy back in cheaper.
Disclaimer: This is only my third chart I have published. EMC2 chart was pretty spot on other than the unexpected moon landing that happened lol. I have no previous trading experience and just got into crypto back in August of 2017.
Pointers are welcome, as I'm just going off of what I have self taught these past few months. I'm sure there is a lot I do not know with actually measuring waves etc, I was just eyeballing where it hit fib in the past.

NXT/BTC 4H Chart 5th wave ABC PredictionThis is a follow up to the chart I just posted since I honestly have no idea how other guys are putting pictures in comments section of other charts. This chart has the fib adjusted for if this is in fact the 5th wave, and the ABC has been adjusted along with it.
For reference, the C wave has been tending to touch or go slightly below 0.382 retracement. This should get you ballpark on buy in prices/sell prices. If it goes this route, expect the rocket ships after.
Disclaimer: (Again, I'm new to this so trade at your own risk.)


NXT In need of small correctionPrice has fallen below the Tenkan Sen. Seen bearish divergence on the hourly RSI. Potential h&s forming also. Would be healthy for a small retrace. I expect it to find support at the Kijun Sen around 3.2k Sats.Lucky trading all xo

NXTDecember 24 in the network NXT expected hard fork, from a technical and fundamental point of view, the coin looks promising

$NXT next targetEarly entry - red. Good entry - blue. Perfect entry - orange. Mid term targets are 4400, 6000 and 9000 sats.

NXT to potentially double until december 25NXT will be extremely bullish leading up to the IGNIS airdrop on December 25th where for every 1 NXT you will get .5 IGNIS. One to certainly watch for some potentially good gains.

NXT BTC JUST BROKE OUT OF FLAGDon't forget about the IGNIS coin airdrop on December 25th. For every 1 NXT you have in your wallet you get 0.5 IGNIS. IGNIS will be used with the ARDOR blockchain.

NXT 1D Timeframe Chart 3 December 2017NXT, on to this one. A coin which gained a lot of momentum the last few weeks. From the highest spike (ATH) in June, it retraced back to the golden 1.618 Fibonacci Level and started another run up, so we can flip the fibonacci from here as well. Currently fighting the earlier top on an earlier Elliott wave in May was well. This level seemed to be suppport sometimes on the bearish run, so it can be some battle for sure.
I'm expecting a little correction after the insane climb from the last few weeks before this one moves on.
Will update this chart weekly as well.

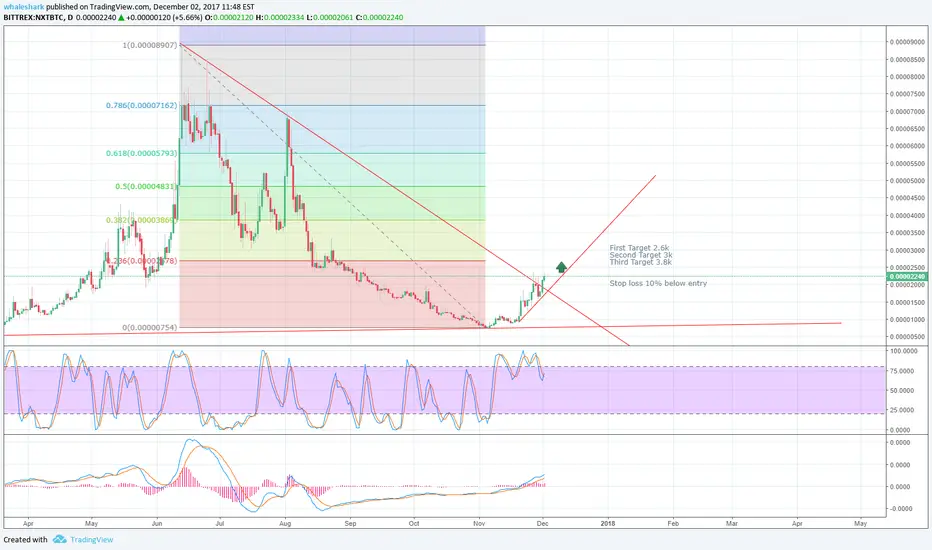
NXT Target UpdateNXT finally broke out for the descending triangle. I think the same targets are possible because of the upcoming hard fork and IGNIS airdrop.
First Target 2.6k
Second Target 3k
Third Target 3.8k
Stop loss 10% below entry
NXT/BTC Bull Run Ahead of Ignis AirdropWith a good edge-to-edge cloud setup and the Ignis airdrop approaching in the last week of December, we have signs of a strong bull run. The flat top of the cloud gives us a good target at 3850.


NXTBTCThis is incredibly exciting to watch.
What am I looking at?
To summarise the story of the chart - Bullish future ahead.
Price stalling at key resistance level 3873 sats. If price can break above and keep there new target (5073 sats) can be reached. First confirmation I will look at is a break to the upside of the yellow consolidation triangle. If this pattern fails, I will be observing pull back targets for a buy in (yellow lines). Its been a great run with 170% from my entry (should have probably posted it here), but working two jobs can really mess with your time!
Look luck all.

NXT updatesNXT broke its short term upper trend line and raced off towards the longer term fib just exceeding 38% and touching the Ichimoku cloud.
At this point it has performed a double top and is now retracing as expected, having just passed the short term fib 23% mark, and heading towards the bottom of the Bollinger bands.
Watch whether it bounces on the short term 38% fib at around 3000, or for a greater retrace to the longer term 23% fib at 2580. Short term RSI is heading towards oversold so the former may be more likely.
When it bounces is a good buy point, set your stop loss. There is support at 2200 or on the trendline at 1900.

NXT further updatesSomething slightly odd happened with the chart scale on my previous analysis so I'm reposting this with an update from the last couple of hours.
NXT broke its short term upper trend line and raced off towards the longer term fib just exceeding 38% and touching the Ichimoku cloud .
At this point it has performed a double top and has retraced bouncing off the short term fib 38% mark, at 3200. The bounce has taken it past the 23% fib and it is currently falling back down.
We may be currently entering a bull pennant formation before looking for higher highs - hitting the long term 61.8% fib at 5540 is not unreasonable given the three previous highs in the last 6 months have exceeded this point.
When it bounces at the bottom of the pennant is a good buy point, set your stop loss in case it breaks downward. There is support at 2200 or on the trendline at 1900, while new support may be forming at 3200.

$BXT.X Weekly clock work iCalled it at 1500. Another double from here :) lower kelt bounce off weekly
