NXTBTC trade ideas
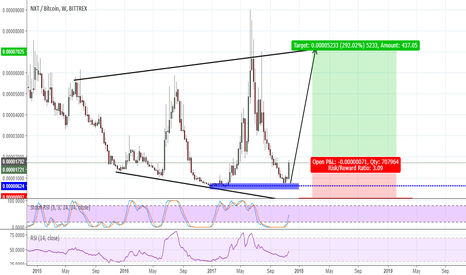
NXT Short Term Comeback?NXT looks to be nicely completing the Wave A retracement as the descending triangle pattern is deep and right below the 0.786 fib level. This is usually a prime level to enter on coins. Volume is also decreasing and going into the stall zone which is a good indicator of a breakout. This however will begin the B Wave so be sure to lock in your profits and hop out as the coin gets near finishing it's correction. Are you in on this coin? Let me know.
NXT 'Calling Tops' Chart 14 January 2018Alright, first topic to discuss is 'calling tops' topic.
In my opinion there's three ways to call tops:
- Fibonacci levels (you could combine these with Elliott Waves if you want to).
- Top of the parabolic trend
- Top of the channel
On the bottom two I'll give an example another time, but today I'll focus on the first one, fibonacci levels.
(apart from the earlier higher levels back in 2015, I'm giving examples according to the yellow, orange and red box).
So, we've seen a nice move up in the summer of 2016. After that, we've seen a nice move up back in the same period in 2017 and a last one is the red box, the last upmove in the last few months.
One of them is according to the airdrop of IGNIS, one of them is according to the airdrop of ARDR.
As you see, the top of the orange box is exactly the 1.618 level from the earlier top back in 2016. The same we'll see in the red box when you draw the fibonacci levels with 1 as top on the top of the orange box.
Why is that? In Fibonacci is the 0.618 level (or 0.382 flipped around) the major level. 1.618 is called 'The Golden Ratio' and is one of the hardest resistances to break through. Most of the time you'll see a bounce down (sometimes a little spike up, but the candle doesn't close higher than this level), so jumping in on the bottom, placing a sell order just below this level and most definitely you'll make great profits.
What do we see more?
- Buy the rumor, sell the news.
- Don't jump on hyped coins and don't buy green candles.
- Waves/cycles, everything goes in waves.
Then about $NXT for the future. Will it stop pumping? I don't think so, we'll see accumulation for the coming months before we'll make another move. 2018 will be a volatile year.
Thanks, see you tomorrow!
NXT Price AnalysisI'm neutral in this position because we just saw the spike in price from the IGNIS airdrop and currently trying to escape this downtrend. I'm taking a small position here, and going to accumulate more in the ~2500 sat range. The MACD is signaling for a bullish breakout in the next couple days. Keep an eye on this one!
NXT Huge Potential - Make profit in Short and Mid TermSome Signals show that it is right time to buy , hold and make profit with NXTBTC (Bittrex)
Buy below: 0.000033
Sell at:
Target 1: 0.00003985
Target 2: 0.00005322
Target 3: 0.00007989
Target 4: 0.00010000
Target 5: Update ++
Note: Depend on Bitcoin trend to adjust right time.
NXT 4H Cup & Handle Down 300% Since IGNIS 50% Short 300% Long Here is another trade for everyone! In my trades I am hoping to find quick gainers for folks looking for short investment cycles as well as trades that can be held for long term higher returns. I intend to provide entry points, trade targets, profit gathering plans and stop losses. These trades are based on chart research, technical analysis , and current media/ market perceptions. I advise how I plan to take my unrealized gains(profit) from the trade until I have recouped all my initial investment. At this point you will be trading on house money.I also will point out at which point you can take the initial profit as suggested by the chart for quick gains. As always this is my trade opinion and the strategy i am implementing for my trades. Do your own research and never risk more then you can afford to loose. Please feel free to ask me questions and or comment your thoughts on my ideas.
Thank You & Good Luck!!
This coin has had some consolidation after its plummet to the bottom and has now formed a cup and handle and as other very bullish signs. This is a good platform with a good team. I think this is a good buy and hodl coin.
Entry Point .00003726 (support line) to .00004000
2) Target .00005841 (.786 FIB)
3) Target .00007717 (.618 FIB) Take Profit 50%
4) Target .00009034 (.5 FIB) Take Profit 25%
5) Target .00010352 (.382 FIB) Take Profit 25% (House Money Now)
6) Target .00011982 (.236 FIB)
7) Target .00014618 (0 FIB)
Stop Loss .00003000 20% +/-
Close trade at .00005841 for 50% Gain
Remember to evaluate using your risk model and trading plan. This is a short term/ longterm trade. Patience is the Key! As always I will follow this trade and update it along the way!


