Trade Setup Breakdown for MoneyLion Inc. (ML) - 30-Min Chart!📊
🔹 Asset: MoneyLion Inc. (ML)
🔹 Timeframe: 30-Min Chart
🔹 Setup Type: Descending Triangle Breakout
🚀 Trade Plan:
✅ Entry Zone: $87.00 - $87.14 (Breakout Confirmation)
✅ Stop-Loss (SL): $86.53 (Below Key Support)
🎯 Take Profit Targets:
📌 TP1: $87.71 (First Resistance)
📌 TP2: $88.50 (Extended Target)
📊 Risk-Reward Ratio Calculation:
📉 Risk (Stop-Loss Distance):
$87.00 - $86.53 = $0.47
📈 Reward to TP1:
$87.71 - $87.00 = $0.71
💰 Risk-Reward Ratio to TP1: 1:1.5
📈 Reward to TP2:
$88.50 - $87.00 = $1.50
💰 Risk-Reward Ratio to TP2: 1:3.2
🔍 Technical Analysis & Strategy:
📌 Breakout Confirmation: Watch for strong volume push above $87.14.
📌 Pattern Formation: Descending Triangle, signaling a potential bullish breakout.
📊 Key Support & Resistance Levels:
🟢 $86.53 (Support / SL Level)
🟢 $87.00 - $87.14 (Breakout Zone)
🟢 $87.71 (First Profit Target / Resistance)
🟢 $88.50 (Final Target for Momentum Extension)
🚀 Momentum Shift Expected:
If price holds above $87.14, we could see a rally towards $87.71 and beyond.
🔥 Trade Execution & Risk Management:
📊 Volume Confirmation: Ensure strong buying volume above $87.14 before entering.
📈 Trailing Stop Strategy: If price reaches TP1 ($87.71), move SL to $87.14 to protect profits.
💰 Partial Profit Booking Strategy:
✔ Take 50% at $87.71, let the rest run to $88.50.
✔ Adjust Stop-Loss to Break-even ($87.14) after TP1 is hit.
⚠️ Fake Breakout Risk:
If price fails to hold above $87.00, be cautious and avoid entering early.
🚀 Final Thoughts:
✔ Bullish Setup – If price sustains above $87.14, a strong move is expected.
✔ Momentum Shift Possible – Watch for volume increase to confirm the trend.
✔ Favorable Risk-Reward Ratio – 1:1.5 to TP1, 1:3.2 to TP2.
💡 Stick to the plan, manage risk, and trade smart! 🚀🏆
🔗 #StockTrading #ML #BreakoutTrade #TechnicalAnalysis #MarketTrends #DayTrading #ProfittoPath
ML trade ideas

$ML Trading Idea: Technical Analysis: MoneyLion Inc. ( NYSE:ML ) Daily Chart
1. Trend Analysis
Primary Trend:
The chart shows a long-term downtrend starting from August 2022 to early 2023, marked by lower highs and lower lows.
A reversal occurred around May 2023, transitioning into a bullish uptrend with higher highs and higher lows.
Key Observations:
50-Day SMA (not visible but inferred): Appears supportive during the uptrend phase.
200-Day SMA (Blue Line): Price recently crossed above the 200-SMA (~$65.75). This is a key bullish signal, as it indicates improving momentum and long-term investor confidence.
✅ Bullish Note: Price trading above the 200-SMA confirms a shift to positive sentiment.
2. Resistance and Support Levels
Resistance:
Major resistance is around $92.00, where the price stalled and formed the blue-highlighted Darkpool Zone.
Current Price (~$86.25) is struggling to break above this resistance.
Support:
Key Support Levels:
Near $65.75 (200-SMA).
Additional support around $50.00, which acted as a consolidation zone during the uptrend.
📉 Caution: If price fails to break $92, it could retrace toward the 200-SMA for support.
3. Darkpool Activity
A significant Darkpool Premium of $14,974,849.35 is highlighted at ~$92.00.
This indicates institutional selling or interest at this level.
Darkpool resistance zones often act as a ceiling unless buying pressure sustains above it.
4. Momentum and Volume
Volume:
Increased volume is observed as the price approached the $92.00 level, indicating strong buyer activity.
Squeeze Indicator (Bottom Panel):
The squeeze histogram shows increasing bullish momentum (blue bars) leading into November 2023.
Red bar at the far-right signals a possible weakening in momentum, suggesting caution near resistance.
5. Key Metrics (Fundamentals)
Revenue Growth: 24.27%
Free Cash Flow Margin: 26.06%
X-Value: 21.66
📊 Fundamental Backdrop:
Strong growth metrics align with bullish technical momentum. However, price behavior at resistance must confirm further upside.
Summary of Analysis
🔍 Bullish Signals:
Price trading above the 200-SMA.
Bullish momentum and improving volume.
Strong fundamentals (Revenue growth and cash flow margin).
⚠️ Key Risks:
Resistance at $92.00 remains strong; failure to break above may lead to a pullback toward $65.75.
Momentum weakening near resistance (as indicated by the Squeeze Histogram).
Trade Plan
Bullish Breakout:
Wait for a daily close above $92.00 with volume confirmation.
Target: $108.00+ (next psychological resistance).
Pullback Buy:
If price rejects $92.00, look for support around $65.75 (200-SMA) for potential long entries.
Stop-Loss:
Place stop-loss just below $65.00 if entering long positions.

ML really looks bullish for me. Long term investedI think ML hammer candle and OBV signal really looks bullish. The stock from what I understand of what I have read is fundamental good too.
I want to hold this for a long term, and I think i got a signal to get in some more

ML/MVIS taking profitsI have been long this pairs trade for about 6 weeks and it's made +60% and reached the top of my target band so taking profit here.

Moneylion (ML) - Looks ready for the next legCompany Info:
MoneyLion Inc. is a data-driven, digital financial platform. It offers mobile banking and financial membership to take control of their finances.
Financials are seeing a nice run up from last year. It has good momentum on its side.
Technicals:
Closing above 52 on Friday when the whole market was down is a sign that buyers are ready to push this higher. It has taken a breather and looks ready to go again.
Will wait for the price action for the first 5 mins before taking longs.
Stops will be just below 48.

MoneyLion IncMoneyLion Inc. (NASDAQ:ML ) is a prominent player in the financial technology sector, powering a range of personalized products and services designed to enhance the financial well-being of its customers. The company has been actively involved in several initiatives aimed at accelerating digital transformation within the banking sector and extending financial services to a broader audience. A recent alliance with EY underscores MoneyLion's commitment to driving innovation and growth within the banking industry, highlighting its role in facilitating banks' digital transformation efforts.
MoneyLion's participation in Needham's 26th Annual Growth Conference and its consistent efforts in community engagement, such as partnering with Bubba Wallace, Tyler Reddick, and 23XI Racing for charitable initiatives, reflect its active involvement in both industry discussions and social responsibility. These activities not only strengthen MoneyLion's market presence but also emphasize its dedication to leveraging technology for financial inclusion and community support.
The company's achievement in being awarded "Best Financial Literacy Tool" at Benzinga's 2023 Global Fintech Awards further validates its effectiveness in providing valuable financial education and tools to its users. This recognition is a testament to MoneyLion's innovative approach to financial technology, focusing on personalization and user empowerment.
For investors and stakeholders, MoneyLion's recent activities and recognitions might indicate a strong potential for growth and innovation in the fintech space. With a current stock price showing positive momentum and a performance outlook that suggests optimism in the short to long term, MoneyLion appears to be a noteworthy consideration for those interested in the fintech industry.
NOT TRADING ADVICE. ALWAYS DO YOUR OWN RESEARCH.

Moneylion: Inverse Head and Shoulders, reversal coming
I've previously posted my article on the strength and potential of NYSE:ML as a company. My thesis still stands in a mid-term perspective. Additionally, lowering of interest rates and a rotation out of large cap stocks will be very beneficial for Moneylion.
On a technical level, MACD, RSI, and TTM Squeeze prove strong on the 4H chart.
Additionally, 9 and 21 day SMA have crossed.
There was no justification for the recent downturn, and the charts prove a reversal could be coming in the near-term for a company that's strong in the long-term.

Moneylion: Great entry for this fintech innovatorNYSE:ML Moneylion, a corporation with a highly effective marketing strategy through media and social media influencers, currently has nowhere to go but up. With a CAC (customer acquisition cost) of only 15$, growing EPS and EPS estimate, and a estimation of profitability by 2025 - Moneylion creates a great entry point following the recent pullback.
Thesis: Moneylion's customer base is consistently growing and will continue to grow. It's well known that many Millennial and Gen-Z individuals early in the workforce have been struggling with long-term finances, especially during current heavy inflationary conditions. This means that cash advances and loans can seem very attractive, and it's likely these will continue to seem more attractive through an uncertain economy.
Moneylion's Q3 2023 net income in September was only a loss of 4.1 million, and a profitable net income before 2025 could result in a signifcant increase in Moneylion's share price. Their advertising strategy and historically high customer growth could lead to a profitable quarter soon.
On a technical basis:
Moneylion may decrease in the near term, but a reversal may be highly probable after this decrease. There isn't much justification for this decrease in share price besides early investors taking profit.
The overall trend remains relatively strong despite the pullback. My price target for ML remains at 82$.
This is my own analysis based on my own setup. Feel free to comment your opinions on this.
**Disclaimer: This is not finacial advice. Please do proper due diligence before risking your own capital.**

$ML @MoneyLion #MoneyLion Double Bottom Are we seeing a double bottom here? Let's see in a few days. Follow me for trading ideas!

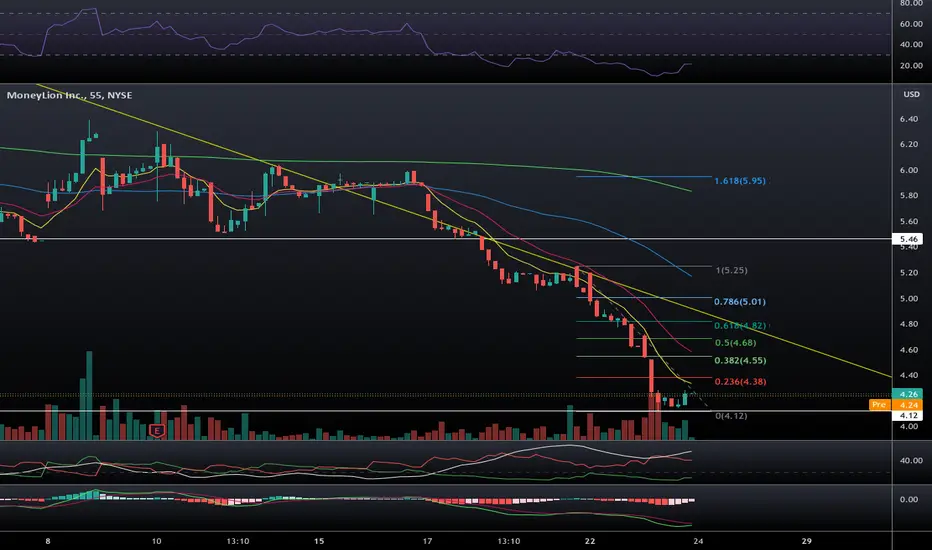
ML OversoldML has tanked in recent months and made a new 52 week low at 4.12
The RSI is extremely low at 25. Using the 55 minute chart it looks like the bottom could potentially be in with possible support at 4.15.
This could be the start of a reversal, however it is extremely early if it is. I am going to take a starter at this level with a tight stop.
Targeting the Fibonacci levels on the way up to $5.46.