NZDUSD Discretionary Analysis: No Parachute, Just GravityNo deep analysis here, just think it’ll fall without a parachute. If I’m right, I make some, if I’m not, I’ll just grab a coffee and wait for the next pair to make its move.
Just my opinion, not financial advice.
NZDUSD trade ideas

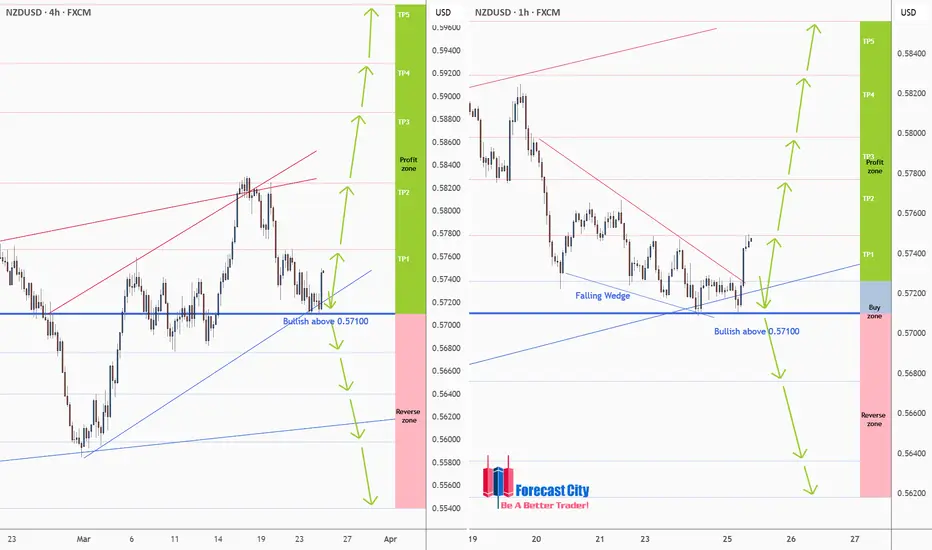
NZDUSD - H4, H1 Forecast - Technical Analysis & Trading IdeasTechnical analysis is on the chart!
No description needed!
OANDA:NZDUSD
__________________________________________________________________
❤️ If you find this helpful and want more FREE forecasts in TradingView,
. . . . . . . . Hit the 'BOOST' button 👍
. . . . . . . . . . . Drop some feedback in the comments below! (e.g., What did you find most useful? How can we improve?)
🙏 Your support is appreciated!
Now, it's your turn!
Be sure to leave a comment; let us know how you see this opportunity and forecast.
Have a successful week,
ForecastCity Support Team
NZDUSD → Consolidation within the correctionFX:NZDUSD is forming a local correction on the background of the uptrend. The dollar has been consolidating and strengthening for the last week, which generally creates pressure on the forex market
NZDUSD after a false break of the trend resistance, which also coincided with the stopping of the strong decline of the dollar, entered the correction phase. Locally, it is a downtrend, followed by consolidation, which in general forms a flag - a figure of continuation of the movement.
The chart reveals strong levels that can be paid attention to. The dollar may continue its growth due to the US policy, which generally has a negative impact on the market.
The price exit from the current consolidation may be accompanied by a strong impulse. Emphasis on 0.575 - 0.571.
Resistance levels: 0.57426, 0.57674
Support levels: 0.571, 0.5684
After stopping at 0.571, the price is not pulling back, but forming consolidation on the background of the local downtrend. Most likely a big player lures the crowd to get to the imbalance zone or trend support at their expense.
Regards R. Linda!

NZDUSD - Like a Bow and Arrow!!Hello TradingView Family / Fellow Traders. This is Richard, also known as theSignalyst.
📈NZDUSD has been overall bullish trading within the rising wedge pattern marked in blue.
Today, NZDUSD is retesting the lower bound of the wedge.
Moreover, it is approaching a strong structure marked in green.
🏹 Thus, the highlighted blue circle is a strong area to look for buy setups as it is the intersection of structure and lower blue trendline acting as a non-horizontal support.
📚 As per my trading style:
As #NZDUSD approaches the blue circle zone, I will be looking for bullish reversal setups (like a double bottom pattern, trendline break , and so on...)
📚 Always follow your trading plan regarding entry, risk management, and trade management.
Good luck!
All Strategies Are Good; If Managed Properly!
~Rich
Disclosure: I am part of Trade Nation's Influencer program and receive a monthly fee for using their TradingView charts in my analysis.

NZDUSD: Trading Within a Narrow 50-pip RangeNZDUSD: Trading Within a Narrow 50-pip Range
The NZDUSD currency pair has been trading within a narrow 50-pip range, stuck between 0.5710 and 0.5760 for about 10 days. It seems likely that this sideways movement will continue in the coming week, as there are no major developments expected.
Next week, two key events could impact the US dollar. The first is the decision on Trump's tariffs, expected by April 2 or 3. The second is the release of Non-Farm Payroll (NFP) data. The U.S. is forecasted to report a decline in job growth to 128,000, down from 151,000 in the previous month.
Market conditions may remain choppy, and even if NZDUSD moves lower, I don't expect it to fall below 0.5680. The reversal zone between 0.5680 and 0.5710 will likely remain critical for the pair to regain upward momentum, as highlighted on the chart.
You may find more details in the chart!
Thank you and Good Luck!
❤️PS: Please support with a like or comment if you find this analysis useful for your trading day❤️
Disclosure: I am part of Trade Nation's Influencer program and receive a monthly fee for using their TradingView charts in my analysis.

NZDUSD Discretional Analysis: It’s Gonna Drop, BroNo deep analysis here, just think it’ll go lower. If I’m right, I make some, if not, I lose.
Just my opinion, not financial advice.

NZDUSD to find buyers at market price?NZDUSD - 24h expiry
Price action has stalled at good support levels and currently trades just above here (0.5725).
We expect a reversal in this move.
Risk/Reward would be poor to call a buy from current levels.
A move through 0.5775 will confirm the bullish momentum.
The measured move target is 0.5800.
We look to Buy at 0.5725 (stop at 0.5690)
Our profit targets will be 0.5795 and 0.5800
Resistance: 0.5775 / 0.5795 / 0.5800
Support: 0.5725 / 0.5700 / 0.5690
Risk Disclaimer
The trade ideas beyond this page are for informational purposes only and do not constitute investment advice or a solicitation to trade. This information is provided by Signal Centre, a third-party unaffiliated with OANDA, and is intended for general circulation only. OANDA does not guarantee the accuracy of this information and assumes no responsibilities for the information provided by the third party. The information does not take into account the specific investment objectives, financial situation, or particular needs of any particular person. You should take into account your specific investment objectives, financial situation, and particular needs before making a commitment to trade, including seeking advice from an independent financial adviser regarding the suitability of the investment, under a separate engagement, as you deem fit.
You accept that you assume all risks in independently viewing the contents and selecting a chosen strategy.
Where the research is distributed in Singapore to a person who is not an Accredited Investor, Expert Investor or an Institutional Investor, Oanda Asia Pacific Pte Ltd (“OAP“) accepts legal responsibility for the contents of the report to such persons only to the extent required by law. Singapore customers should contact OAP at 6579 8289 for matters arising from, or in connection with, the information/research distributed.

NZDUSD Continues to Develop A Large Channel PatternNZDUSD Continues to Develop A Large Channel Pattern
NZDUSD began a bullish movement at the beginning of February and the price is in a bullish movement taking the shape of a large channel pattern.
Price is already near to a strong support zone and it can resume the bullish movement between 0.5720 - 0.5660 zone
Given that the price is also holding strong the chances are growing that it may rise again as shown on the chart
You may find more details in the chart!
Thank you and Good Luck!
❤️PS: Please support with a like or comment if you find this analysis useful for your trading day❤️
Disclosure: I am part of Trade Nation's Influencer program and receive a monthly fee for using their TradingView charts in my analysis.

NZDUSD Short BiasThe New Zealand Dollar is consolidating, lacking clear directional momentum. However, the short-term outlook appears bearish following a confirmed closure below a key structure zone. A break below the 0.5710 level could serve as confirmation for further downside continuation, signaling potential bearish momentum ahead.

NZDUSD has broken it's support and already in Down TrendNZDUSD has broken its support and is already experiencing a downward trend.
A short position may be taken.

Potential bearish breakout?NZD/USD is reacting off the support level which is a pullback support and could breakout from this level to our take profit.
Entry: 0.5712
Why we like it:
There is a pullback support level that is slightly above the 61.8% Fibonacci projection.
Stop loss: 0.5735
Why we like it:
There is a pullback resistance level.
Take profit: 0.5680
Why we like it:
There is a pullback support level that aligns with the 161.8% Fibonacci extension.
Enjoying your TradingView experience? Review us!
Please be advised that the information presented on TradingView is provided to Vantage (‘Vantage Global Limited’, ‘we’) by a third-party provider (‘Everest Fortune Group’). Please be reminded that you are solely responsible for the trading decisions on your account. There is a very high degree of risk involved in trading. Any information and/or content is intended entirely for research, educational and informational purposes only and does not constitute investment or consultation advice or investment strategy. The information is not tailored to the investment needs of any specific person and therefore does not involve a consideration of any of the investment objectives, financial situation or needs of any viewer that may receive it. Kindly also note that past performance is not a reliable indicator of future results. Actual results may differ materially from those anticipated in forward-looking or past performance statements. We assume no liability as to the accuracy or completeness of any of the information and/or content provided herein and the Company cannot be held responsible for any omission, mistake nor for any loss or damage including without limitation to any loss of profit which may arise from reliance on any information supplied by Everest Fortune Group.

Market Analysis: NZD/USD Struggles to Sustain Gains—What’s Next?Market Analysis: NZD/USD Struggles to Sustain Gains—What’s Next?
NZD/USD is also moving lower and might extend losses below 0.5700.
Important Takeaways for NZD/USD Analysis Today
- NZD/USD declined steadily from the 0.5760 resistance zone.
- There is a major bearish trend line forming with resistance at 0.5715 on the hourly chart of NZD/USD at FXOpen.
NZD/USD Technical Analysis
On the hourly chart of NZD/USD on FXOpen, the pair also followed a similar pattern and declined from the 0.5760 zone. The New Zealand Dollar gained bearish momentum and traded below 0.5725 against the US Dollar.
The pair settled below the 0.5720 level and the 50-hour simple moving average. Finally, it tested the 0.5695 zone and is currently consolidating losses.
Immediate resistance on the upside is near the 50% Fib retracement level of the downward move from the 0.5736 swing high to the 0.5693 low at 0.5715. There is also a major bearish trend line forming with resistance at 0.5715.
The next resistance is the 0.5725 level or the 76.4% Fib retracement level of the downward move from the 0.5736 swing high to the 0.5693 low. If there is a move above 0.5725, the pair could rise toward 0.5750.
Any more gains might open the doors for a move toward the 0.5800 resistance zone in the coming days. On the downside, immediate support on the NZD/USD chart is near the 0.5705 level.
The next major support is near the 0.5695 zone. If there is a downside break below 0.5695, the pair could extend its decline toward the 0.5665 level. The next key support is near 0.5640.
This article represents the opinion of the Companies operating under the FXOpen brand only. It is not to be construed as an offer, solicitation, or recommendation with respect to products and services provided by the Companies operating under the FXOpen brand, nor is it to be considered financial advice.

NZDUSD Analysis Today: Technical and Order Flow !In this video I will be sharing my NZDUSD analysis today, by providing my complete technical and order flow analysis, so you can watch it to possibly improve your forex trading skillset. The video is structured in 3 parts, first I will be performing my complete technical analysis, then I will be moving to the COT data analysis, so how the big payers in market are moving their orders, and to do this I will be using my customized proprietary software and then I will be putting together these two different types of analysis.

Potential bullish bounce?NZD/USD is reacting off the support level which is a pullback support and could bounce from this level to our take profit.
Entry: 0.5665
Why we like it:
There is a pullback support level that lines up with the 78.6% Fibonacci projection.
Stop loss: 0.5634
Why we like it:
There is a pullback support level that line sup with the 78.6% Fibonacci retracement.
Take profit: 0.5710
Why we like it:
There is a pullback resistance level that lines up with the 50% Fibonacci retracement.
Enjoying your TradingView experience? Review us!
Please be advised that the information presented on TradingView is provided to Vantage (‘Vantage Global Limited’, ‘we’) by a third-party provider (‘Everest Fortune Group’). Please be reminded that you are solely responsible for the trading decisions on your account. There is a very high degree of risk involved in trading. Any information and/or content is intended entirely for research, educational and informational purposes only and does not constitute investment or consultation advice or investment strategy. The information is not tailored to the investment needs of any specific person and therefore does not involve a consideration of any of the investment objectives, financial situation or needs of any viewer that may receive it. Kindly also note that past performance is not a reliable indicator of future results. Actual results may differ materially from those anticipated in forward-looking or past performance statements. We assume no liability as to the accuracy or completeness of any of the information and/or content provided herein and the Company cannot be held responsible for any omission, mistake nor for any loss or damage including without limitation to any loss of profit which may arise from reliance on any information supplied by Everest Fortune Group.

NZDUSD: Bullish Move From Support 🇳🇿🇺🇸
NZDUSD looks strongly bullish after a test of a key daily support.
As a confirmation, I see a nice bullish imbalance candle on an hourly
and a double bottom formation.
The pair may rise at least to 0.57323
❤️Please, support my work with like, thank you!❤️
I am part of Trade Nation's Influencer program and receive a monthly fee for using their TradingView charts in my analysis.


nzdusda very solid intersection between the bullish channel and the bearish channel together with the 61.80% fibonachi which shows us a rejection of the upside, we will see a possible rise in nzdusd.

NZD/USD Bullish Reversal – Key Levels & Trade PlanThe 4H chart shows NZD/USD forming a bullish structure with an ascending trendline support.
A breakout from the descending wedge pattern signals potential upside momentum.
The price is currently testing a key support zone near 0.5740, aligning with the 23.6% Fibonacci retracement level.
Trade Setup & Levels:
Entry Zone: Above 0.5740 (support holding)
Target 1 (TP1): 0.5817 – previous resistance
Target 2 (TP2): 0.6050 – Fibonacci 61.8% level
Stop Loss (SL): Below 0.5620 (previous support structure)
Bullish Confirmation Factors:
✅ Trendline support remains intact, preventing further downside.
✅ Breakout from wedge pattern, indicating buying pressure.
✅ Higher lows formation, showing gradual accumulation of demand.
Conclusion:
A confirmed breakout above 0.5817 will validate the bullish move toward 0.6050. If price sustains above the resistance, we expect further upside momentum in the coming sessions. 📈

NZDUSD --> Consolidation in the adjustment phaseOANDA:NZDUSD a localized correction phase is forming within the underlying upward trend. The dollar has strengthened and consolidated throughout the past week, which generally creates pressure on the forex market.
After breaking through resistance levels, coinciding with the slowdown of the sharply declining dollar, entering a correction phase. Locally, this represents a downward trend, followed by consolidation, generally resembling a flag pattern - an image of continued movement. Nearby strong resistance levels are being closely monitored. The dollar may continue to grow due to US policy, generally having a negative impact on the market. Price breakout from the current consolidation phase could be accompanied by strong momentum. Focus remains on 0.575 - 0.571.
From a technical perspective, after stopping at 0.571, the price is not retreating but rather forming a consolidation on the foundation of a local downward trend. It's highly likely that a major player will lure the crowd to an imbalanced zone or support the trend at their expense.

NZD/USD New Entry Valid To Get 150 Pips , Don`t Miss It !Here is a new entry on NZD/USD , I shared the first entry with you and now +150 pips 0 Drawdown , now if we have a daily closure below this blue support then we can enter a new sell trade when the price back to retest the same support and hopefully it will work as a new res , and we will targeting 150 pips .
This Is An Educational + Analytic Content That Will Teach Why And How To Enter A Trade
Make Sure You Watch The Price Action Closely In Each Analysis As This Is A Very Important Part Of Our Method
Disclaimer : This Analysis Can Change At Anytime Without Notice And It Is Only For The Purpose Of Assisting Traders To Make Independent Investments Decisions.

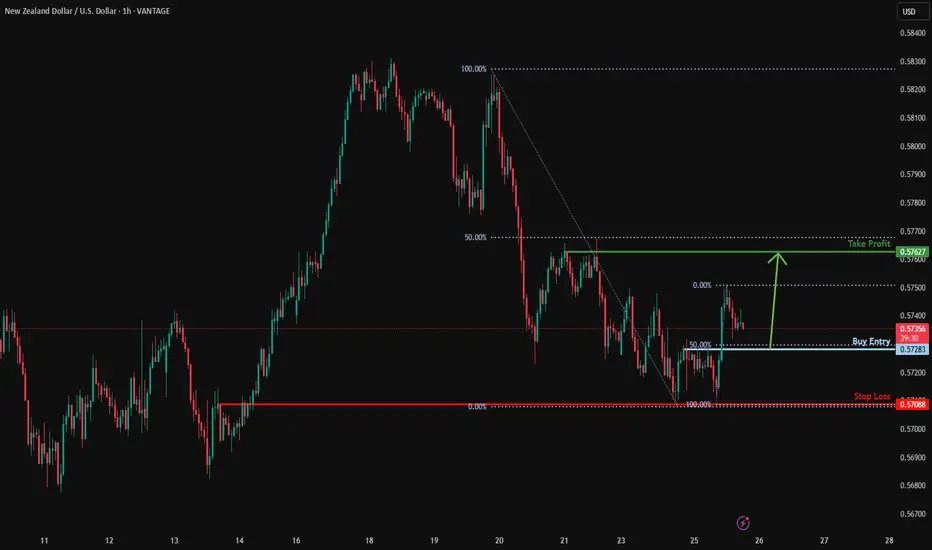
Falling towards 50% Fibonacci support?NZD/USD is falling towards the support level which is a pullback support that lines up with the 50% Fibonacci retracement and could bounce from this level to our take profit.
Entry: 0.5728
Why we like it:
There is a pullback support level that lines up with the 50% Fibonacci retracement.
Stop loss: 0.5708
Why we like it:
There is a pullback support level.
Take profit: 0.5762
Why we like it:
There is a pullback resistance.
Enjoying your TradingView experience? Review us!
NZD/USD NEXT MOVESell after bearish candle stick pattern, buy after bullish candle stick pattern....
Best bullish pattern , engulfing candle or green hammer
Best bearish pattern , engulfing candle or red shooting star
NOTE: IF YOU CAN'T SEE ANY OF TOP PATTERN IN THE ZONE DO NOT ENTER
Stop lost before pattern
R/R %1/%3
Trade in 5 Min Timeframe, use signals for scalping

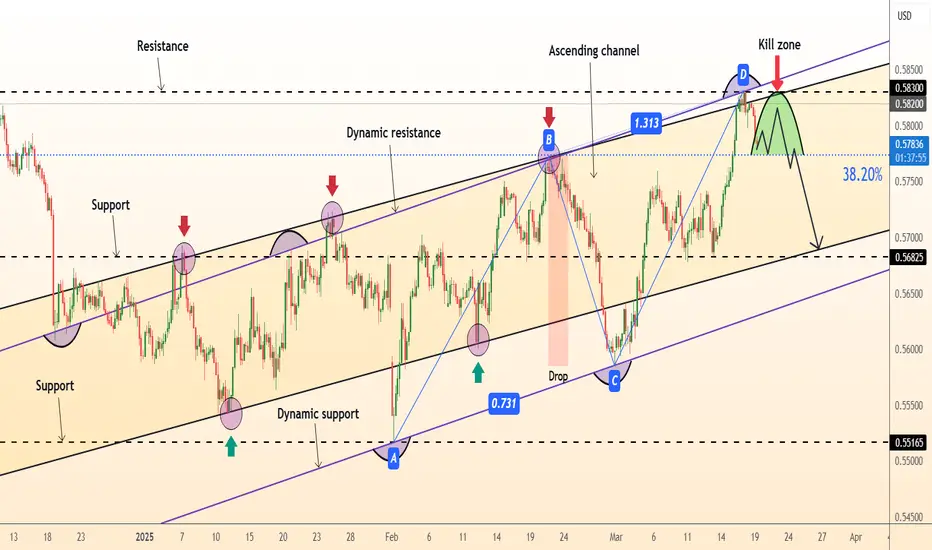
DeGRAM | NZDUSD pullbackNZDUSD is in an ascending channel between trend lines.
The price is moving from the upper boundary of the channel, the upper trend line, which has already acted as a pullback point, as well as from the important psychological resistance level of $0.583.
Indicators point to the bearish divergence being worked out on the 1H Timeframe.
The chart has formed a pattern AB=CD.
We expect a continuation of the pullback in the channel after consolidation under the 38.2% retracement level.
-------------------
Share your opinion in the comments and support the idea with like. Thanks for your support!