Ontology (ONT) - April 23Hello?
Dear traders, nice to meet you.
By "following" you can always get new information quickly.
Please also click "Like".
Have a good day.
----------------------------------
(ONTUSD 1W chart)
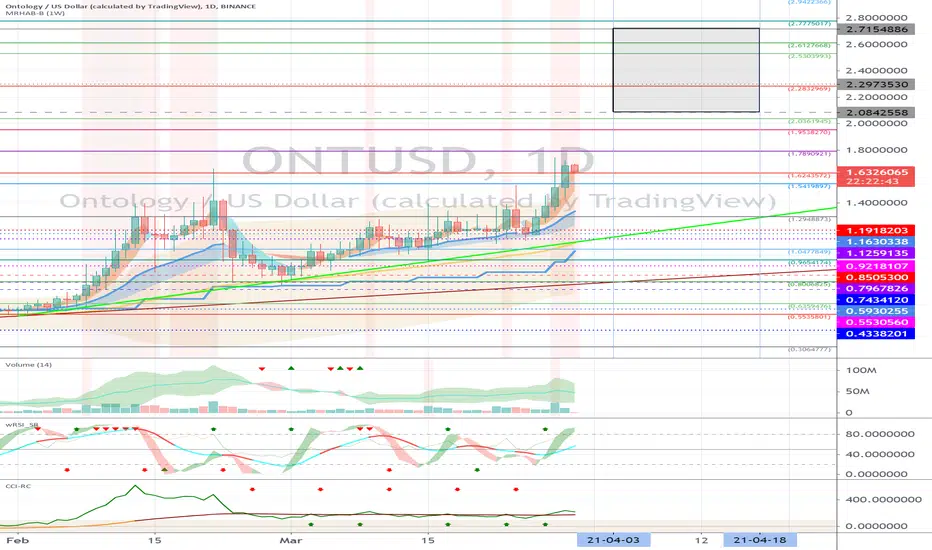
(1D chart)
We need to see if we can get support and climb in the 1.6849639-1.8572747 range.
If it falls at the point of 1.3403424, a Stop Loss is required to preserve profit and loss.
However, it may rise along the uptrend line, so careful trading is necessary.
It remains to be seen if it can become a stockpiling force to break above the critical section 2.0842558-2.7154886.
----------------------------------
(ONTBTC 1D chart)
We have to see if we can get support from the 314 Satoshi-371 Satoshi section and climb along the uptrend line.
-------------------------------------------------- -------------------------------------------
** All indicators are lagging indicators.
So, it's important to be aware that the indicator moves accordingly with the movement of price and volume.
Just for the sake of convenience, we are talking upside down for interpretation of the indicators.
** The wRSI_SR indicator is an indicator created by adding settings and options from the existing Stochastic RSI indicator.
Therefore, the interpretation is the same as the conventional stochastic RSI indicator. (K, D line -> R, S line)
** The OBV indicator was re-created by applying a formula to the DepthHouse Trading indicator, an indicator that oh92 disclosed. (Thank you for this.)
** Check support, resistance, and abbreviation points.
** Support or resistance is based on the closing price of the 1D chart.
** All explanations are for reference only and do not guarantee profit or loss on investment.
Explanation of abbreviations displayed on the chart
R: A point or section of resistance that requires a response to preserve profits
S-L: Stop Loss point or section
S: A point or segment that can be bought for profit generation as a support point or segment
(Short-term Stop Loss can be said to be a point where profits and losses can be preserved or additionally entered through installment transactions. It is a short-term investment perspective.)
GAP refers to the difference in prices that occurred when the stock market, CME, and BAKKT exchanges were closed because they do not trade 24 hours a day.
G1: Closing price when closed
G2: Cigar at the time of opening
(Example) Gap (G1-G2)
ONTPERP trade ideas

ONTUSDT Consolidation doneOnt has been consolidating for 2 years after its ATH and now it's done and break out closing its weekly candle above the consolidation zone. I believe it will go higher to the levels on the chart in 2 months.
Happy profitable trading day. Cya at the moon 🚀🚀


ONT USD huge accumulation patternHi traders !
This is a textbook accumulation pattern i spotted on the ONT USD chart.
Currtently in the SOS phase.
Its an range for over 300 days.
Google : Wyckoff accumulation
You will find the example.
Your face will melt when this takes off....
Target 1 : $4 --> $8
Target 2 $12 - $16
Cheers !

$ont getting hot day by daywelcome to my analysis on $ont, in my opinion it is ready for next leg. More it consolidate more I am bullish..


ONT/USDNot a huge fan of the bearish divergence here, but this is a bull market! Time to start running soon!
I wouldn’t be surprised to see a break - retest - and run to T1...
Do your own research and the isn’t FA :)
GOOOD LUCK!


ONTUSD DailyONTUSD
Daily time frame
good to hold for a long time
short term target 5-6$
------------
Breaking 9$ level and closing above
aim for 20$
Regards


ONT range breakout soonThis is simple. We are in a bull market. Everyone is a genius. 🚀
ONT looks ready to breakout of its accumulation range. Expecting a vertical move soon similarly to ADA.
ICX, RDN have recently initiated their breakouts


ONT/USD looks readyONT looks like it finally wants to break that large resistance zone dating back from the last bull run. If there was a time for it to start its parabolic rise, it would be soon. Worth keeping an eye on this weekly candle close. Above 1.54 = time to hold.
This is not financial advice and do your own research :)
Good luck yall!

Ontology (ONT) - March 30Hello?
Dear traders, nice to meet you.
By "following" you can always get new information quickly.
Please also ask for the "Like" clock.
Have a nice day.
----------------------------------
We have to see if we can get support at 1.6243572 and climb above 1.7890921.
If it falls, you need to make sure you get support in the 1.5419897-1.6243572 range.
If you go down at 1.2948873, you need a short stop loss.
It remains to be seen if it can break above the critical section 2.0842558-2.7154886.
--------------------------------------
(ONTBTC 1D chart)
It appears to have turned to an uptrend as it rises by breaking above the M-Signal line on the 1W chart.
It remains to be seen if it can rise to the 314 Satoshi-371 Satoshi section to continue this upward trend.
If it falls, we need to make sure we get support at the 239 Satoshi spot.
-------------------------------------------------- -------------------------------------------
** All indicators are lagging indicators.
So, it's important to be aware that the indicator moves accordingly with the movement of price and volume.
Just for the sake of convenience, we are talking upside down for interpretation of the indicators.
** The wRSI_SR indicator is an indicator created by adding settings and options from the existing Stochastic RSI indicator.
Therefore, the interpretation is the same as the conventional stochastic RSI indicator. (K, D line -> R, S line)
** The OBV indicator was re-created by applying a formula to the DepthHouse Trading indicator, an indicator that oh92 disclosed. (Thank you for this.)
** Check support, resistance, and abbreviation points.
** Support or resistance is based on the closing price of the 1D chart.
** All explanations are for reference only and do not guarantee profit or loss on investment.
Explanation of abbreviations displayed on the chart
R: A point or section of resistance that requires a response to preserve profits
S-L: Stop Loss point or section
S: A point or segment that can be bought for profit generation as a support point or segment
(Short-term Stop Loss can be said to be a point where profits and losses can be preserved or additionally entered through installment transactions. It is a short-term investment perspective.
GAP refers to the difference in prices that occurred when the stock market, CME, and BAKKT exchanges were closed because they do not trade 24 hours a day.
G1: Closing price when closed
G2: Cigar at the time of opening
(Example) Gap (G1-G2)
$ONT possible 11x in 45 to 60 daysWelcome to my analysis on $Ont,it is one of the old coins will start to go parabolic soon and going to be really profitable in next 45 to 60 days.

Nice breakoutsBreakouts supporting with MA20 and MA50,
money is coming momentum increasing,
I don't see any obstacle to go 1,53$

Possiblity for Ontology to break outOntology has been long under the radar, and only had a 3x gains from the bottom..
There's still plenty of room to grow.
I don't know how they got the gas fees solved, but I think the high gas fees were the major problem..
If anyone has more info.. enlighten me.
I got into the hype in 2018, since then it was a no go.


