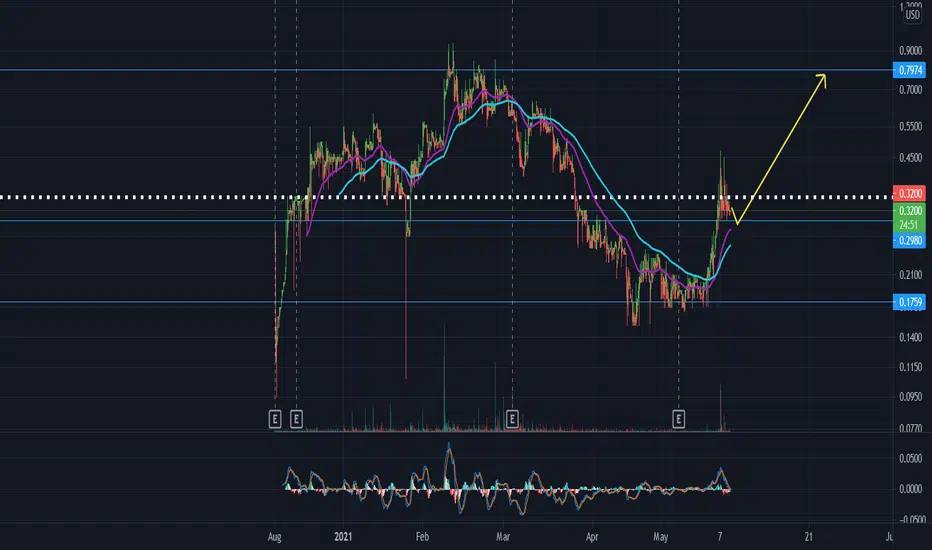
FDCT breakout forming ?I think there is big potential to break out and reach0.70$+ after the current pullback.
FDCT's acquisition of Genesis Financial is a step-change in creating a diversified global financial services company with annualized revenue of $15 million and well-positioned for long-term growth through FDCTec
144.5000
0.0002 USD
80.03 K USD
26.94 M USD
117.43 M
About FDCTech, Inc.
Sector
Industry
CEO
Mitchell M. Eaglstein
Website
Headquarters
Irvine
Founded
2016
FIGI
BBG00QPHWQH6
FDCTech, Inc. engages in the provision of foreign exchange prime brokerage and cryptocurrency solutions. It operates through the following segments: Wealth Management, Technology Software Development, and Margin Brokerage Business. Its products include Condor CryptoWeb Trader, Condor FX Pro, back office risk-management for FIX platforms and pricing engine. The company was founded by Mitchell Eaglstein and Imran Firoz on January 21, 2016 and is headquartered in Irvine, CA.
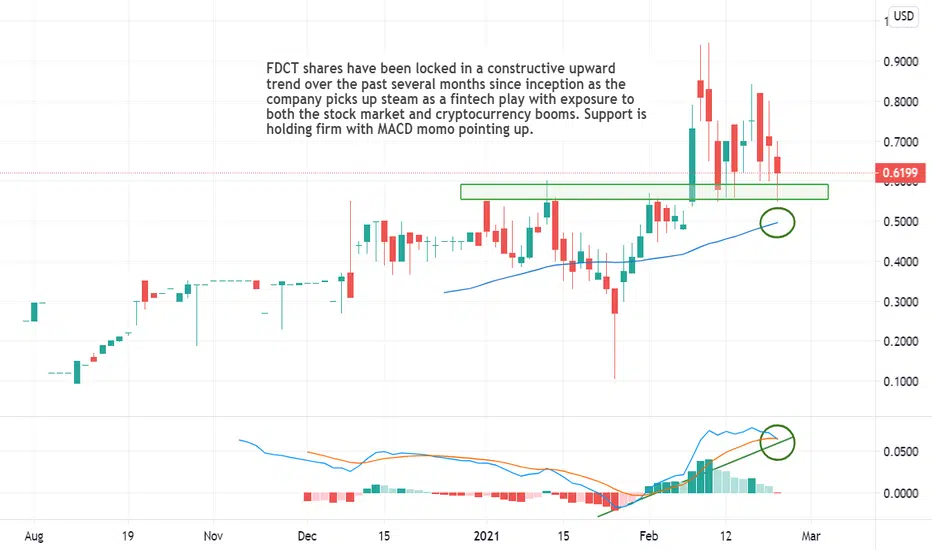
$FDCT Maintains Bullish Posture as Key Fintech Breakout IdeaFDC Tech Inc (OTCMKTS:FDCT) shares have been locked in a constructive upward trend over the past several months since inception as the company picks up steam as a fintech play with exposure to both the stock market and cryptocurrency booms.
Support is holding firm with MACD momo pointing to the up
$FDCT Shares Break Out as Fintech Boom BlossomsFDCT has decisively broken out of its basing range pattern, following a key MACD bull signal, with growing volume. The company has started to pile up catalysts in the fintech space, leveraging both the equity market and crypto market booms in the process.

$FDCT Breakout Powers Stock as Catalysts MountFDC Tech Inc (OTCMKTS:FDCT) provides innovative and cost-efficient financial technology and business solutions to OTC Online Brokerages and cryptocurrency businesses.
Effectively, FDCT is a stock market trading tech story, which is particularly interesting during such a period of high activity and

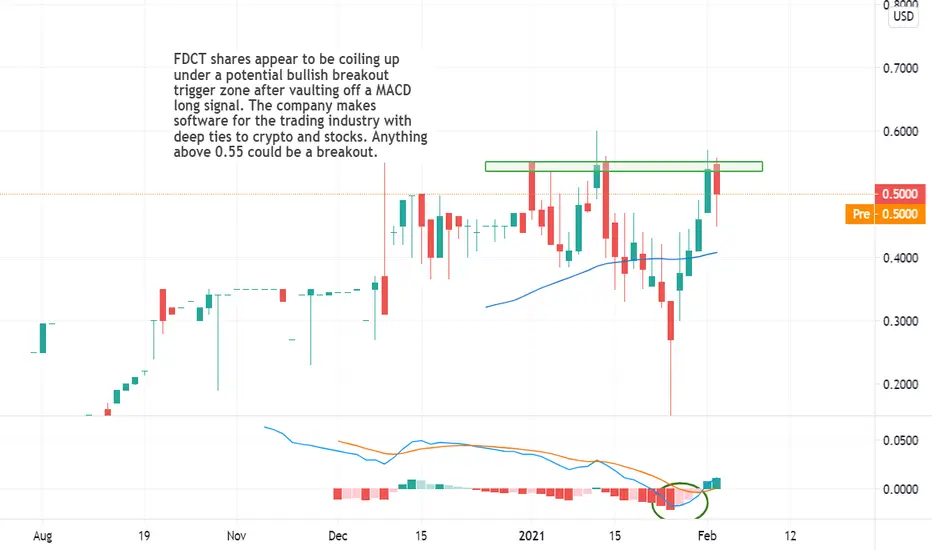
$FDCT Coils Under Breakout Level as Trading Tech Takes OffFDC Tech Inc (OTCMKTS:FDCT) shares appear to be coiling up under a potential bullish breakout trigger zone after vaulting off a MACD long signal. Anything above 0.55 could be a breakout.
The company provides innovative and cost-efficient financial technology and business solutions to OTC Online Bro
$FDCT Is Today’s Low-Float Crypto Breakout Alert
FDCTech, Inc. (OTCQB: FDCT)
Alert Price: $0.41
Float: 15.95M
Technical Analysis
Company Website| | CEO Interview | Recent News
The price of bitcoin is volatile these days, so we apologize if real-time prices differ significantly. As of this writing, bitcoin nearly hit $42,000 per token -- an al

See all ideas
Summarizing what the indicators are suggesting.
Oscillators
Neutral
SellBuy
Strong sellStrong buy
Strong sellSellNeutralBuyStrong buy
Oscillators
Neutral
SellBuy
Strong sellStrong buy
Strong sellSellNeutralBuyStrong buy
Summary
Neutral
SellBuy
Strong sellStrong buy
Strong sellSellNeutralBuyStrong buy
Summary
Neutral
SellBuy
Strong sellStrong buy
Strong sellSellNeutralBuyStrong buy
Summary
Neutral
SellBuy
Strong sellStrong buy
Strong sellSellNeutralBuyStrong buy
Moving Averages
Neutral
SellBuy
Strong sellStrong buy
Strong sellSellNeutralBuyStrong buy
Moving Averages
Neutral
SellBuy
Strong sellStrong buy
Strong sellSellNeutralBuyStrong buy
Displays a symbol's price movements over previous years to identify recurring trends.
Related stocks
Frequently Asked Questions
The current price of FDCT is 0.0201 USD — it has decreased by −30.45% in the past 24 hours. Watch FDCTech, Inc. stock price performance more closely on the chart.
Depending on the exchange, the stock ticker may vary. For instance, on OTC exchange FDCTech, Inc. stocks are traded under the ticker FDCT.
FDCT stock has fallen by −25.00% compared to the previous week, the month change is a −10.67% fall, over the last year FDCTech, Inc. has showed a 18.79% increase.
FDCT reached its all-time high on Feb 10, 2021 with the price of 0.9450 USD, and its all-time low was 0.000001 USD and was reached on Aug 9, 2024. View more price dynamics on FDCT chart.
See other stocks reaching their highest and lowest prices.
See other stocks reaching their highest and lowest prices.
FDCT stock is 43.78% volatile and has beta coefficient of −15.62. Track FDCTech, Inc. stock price on the chart and check out the list of the most volatile stocks — is FDCTech, Inc. there?
Today FDCTech, Inc. has the market capitalization of 12.21 M, it has decreased by −24.86% over the last week.
Yes, you can track FDCTech, Inc. financials in yearly and quarterly reports right on TradingView.
FDCT net income for the last quarter is 941.42 K USD, while the quarter before that showed −649.57 K USD of net income which accounts for 244.93% change. Track more FDCTech, Inc. financial stats to get the full picture.
No, FDCT doesn't pay any dividends to its shareholders. But don't worry, we've prepared a list of high-dividend stocks for you.
EBITDA measures a company's operating performance, its growth signifies an improvement in the efficiency of a company. FDCTech, Inc. EBITDA is −562.80 K USD, and current EBITDA margin is −2.29%. See more stats in FDCTech, Inc. financial statements.
Like other stocks, FDCT shares are traded on stock exchanges, e.g. Nasdaq, Nyse, Euronext, and the easiest way to buy them is through an online stock broker. To do this, you need to open an account and follow a broker's procedures, then start trading. You can trade FDCTech, Inc. stock right from TradingView charts — choose your broker and connect to your account.
Investing in stocks requires a comprehensive research: you should carefully study all the available data, e.g. company's financials, related news, and its technical analysis. So FDCTech, Inc. technincal analysis shows the strong sell today, and its 1 week rating is sell. Since market conditions are prone to changes, it's worth looking a bit further into the future — according to the 1 month rating FDCTech, Inc. stock shows the neutral signal. See more of FDCTech, Inc. technicals for a more comprehensive analysis.
If you're still not sure, try looking for inspiration in our curated watchlists.
If you're still not sure, try looking for inspiration in our curated watchlists.