$PEPESUI Surged 580% to Reclaim the $1Mln Mkt Cap ThresholdThe $PEPESUI coin has surged 580% for the past 8 days to reclaim the $1 Million market cap threshold, enroute to $3 million market cap with an 80% surge as confirmation.
The 4-hour price chart depicts the formation of a cup and handle pattern, a pattern generally seen as a bullish pattern and for
Key stats

Is PEPE About to Explode? Critical Breakout Level Incoming!Yello, Paradisers! Are you ready for what could be the breakout #PEPE bulls have been waiting for since February?
💎After a long, painful downside grind, PEPE is finally shaping up for a potential bullish reversal. The price action has entered an ascending triangle, often a reliable pattern that hin

Breaking: $PEPE on SUI Surg 129% to Reclaim $1.7 Mln Market CapThe first frog-themed memecoin on SUI network that is emulating the PEPE mascot meme has broken out of a cup and handle as we predicted pulling a 129% in gains.
This memecoin has turn out to be a massive shocker since we have predicted its breakout sitting at a $172k in market and has surge as hig


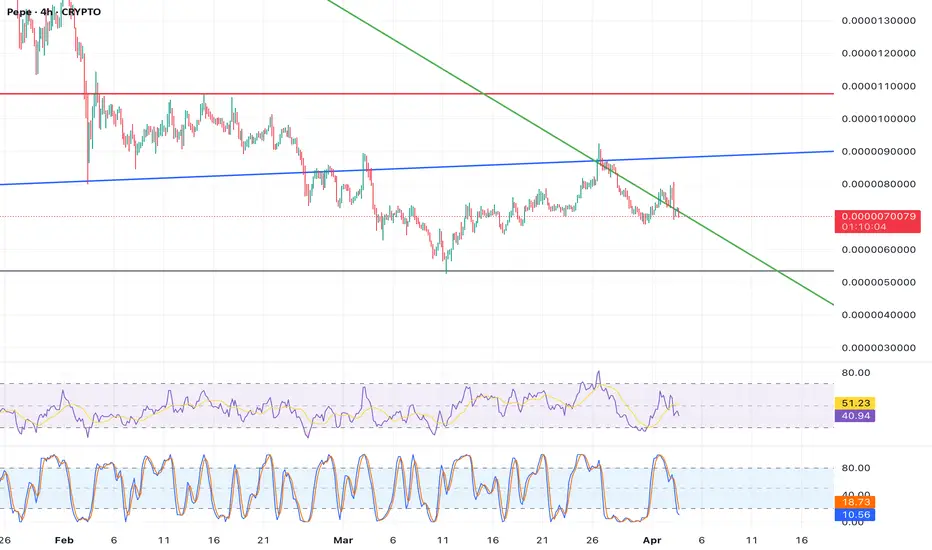
$PEPE potential for H&S here on the Daily...Tagging the bottom BBs and what would be the neckline. Pro Blue Osc pointing down. I'm not short but I'd want to see this play out or invalidate before any long positions.

This Frog Has Legs...Looks like we've bottomed (I think) and we're about to start another parabolic leg to new highs that will last most the year....don't bet against the frog.

Breaking: $PEPE Defies Market Odds Surges 8% TodayThe price of the frog-themed memecoin CRYPTOCAP:PEPE saw an 8% uptick in price today amidst general crypto and stock market turmoil which was largely as a result of the Donald Trump's Tax Tariff on crypto currencies and stock assets.
This move led to the US stock market officially losing $10 tril

$GT’s weekly chart, a compelling setup is formingLooking at NASDAQ:GT ’s weekly chart, a compelling setup is forming. The stock has been carving out a cup-and-handle pattern since mid-2023, with the cup bottoming near $9 and the handle consolidating around $12. This is a textbook bullish continuation pattern, often preceding explosive moves. The
WATCH OUT FOR PEPENo explanation needed; this is one of the top Meme coins to watching. I'm loading here looking for possibly 500 to 1000% with a 50% stop loss.

PEPE: A 10x or a Hopeless Meme?
The price is currently testing the support zone between 0.00000054 and 0.00000039, an area that has previously acted as a strong demand zone. A hidden bullish divergence is forming on the RSI (7), where the RSI is making lower lows while the price remains relatively stable, suggesting potential exh

See all ideas
Summarizing what the indicators are suggesting.
Oscillators
Neutral
SellBuy
Strong sellStrong buy
Strong sellSellNeutralBuyStrong buy
Oscillators
Neutral
SellBuy
Strong sellStrong buy
Strong sellSellNeutralBuyStrong buy
Summary
Neutral
SellBuy
Strong sellStrong buy
Strong sellSellNeutralBuyStrong buy
Summary
Neutral
SellBuy
Strong sellStrong buy
Strong sellSellNeutralBuyStrong buy
Summary
Neutral
SellBuy
Strong sellStrong buy
Strong sellSellNeutralBuyStrong buy
Moving Averages
Neutral
SellBuy
Strong sellStrong buy
Strong sellSellNeutralBuyStrong buy
Moving Averages
Neutral
SellBuy
Strong sellStrong buy
Strong sellSellNeutralBuyStrong buy