PEPEWETH_1DA2BD.USD trade ideas

Is PEPE About to Explode? Critical Breakout Level Incoming!Yello, Paradisers! Are you ready for what could be the breakout #PEPE bulls have been waiting for since February?
💎After a long, painful downside grind, PEPE is finally shaping up for a potential bullish reversal. The price action has entered an ascending triangle, often a reliable pattern that hints at an incoming breakout. This setup is now flashing signals that momentum is shifting but it all hinges on one critical zone.
💎#PEPEUSDT is currently eyeing the $0.0000088 – $0.0000090 region, a heavy resistance that’s proven itself multiple times since February 24th. Bulls have failed to conquer this level on several occasions, and now, the 12-hour EMA-200 is also sitting in this area, a dynamic resistance reinforcing this as a crucial inflection point.
💎If the bulls can finally break through $0.0000090 with clear volume confirmation, PEPE could open up upside potential towards $0.00001135. This level is likely to attract some short-term profit-taking, but if momentum holds, we could see a push towards the much stronger $0.00001400 – $0.00001490 zone. This region lines up with a multi-point confluence, including a significant horizontal resistance and the 38.20% Fibonacci retracement level — both strong technical barriers that may define the next major move.
💎Support is also well-defined for now. The 12-hour EMA-50 is acting as dynamic support and currently sits around the $0.00000720 level. PEPE has been respecting this level well, and any temporary pullbacks may bounce from here. Below this, the $0.00000650 – $0.00000570 range remains the key support zone. This zone held firm during the last dips and is likely to absorb any upcoming selling pressure if the breakout fails short-term.
Paradisers, strive for consistency, not quick profits. Treat the market as a businessman, not as a gambler.
MyCryptoParadise
iFeel the success🌴

$PEPE potential for H&S here on the Daily...Tagging the bottom BBs and what would be the neckline. Pro Blue Osc pointing down. I'm not short but I'd want to see this play out or invalidate before any long positions.

This Frog Has Legs...Looks like we've bottomed (I think) and we're about to start another parabolic leg to new highs that will last most the year....don't bet against the frog.

Breaking: $PEPE Defies Market Odds Surges 8% TodayThe price of the frog-themed memecoin CRYPTOCAP:PEPE saw an 8% uptick in price today amidst general crypto and stock market turmoil which was largely as a result of the Donald Trump's Tax Tariff on crypto currencies and stock assets.
This move led to the US stock market officially losing $10 trillion since President Trump was inaugurated early this year.
Whereas for CRYPTOCAP:PEPE , the asset is already up 5% as of the time of writing in the 4-hour price chart. A break above the 50% Fibonacci retracement point could spark a bullish continuation for CRYPTOCAP:PEPE with the 1-month low acting as support point.
Similarly, Should selling pressure increase, we might experience a break below the 1-month low before a bounced to new highs.
What Is PEPE?
PEPE is a deflationary memecoin launched on Ethereum. The cryptocurrency was created as a tribute to the Pepe the Frog internet meme, created by Matt Furie, which gained popularity in the early 2000s.
The project aims to capitalize on the popularity of meme coins, like Shiba Inu and Dogecoin, and strives to establish itself as one of the top meme-based cryptocurrencies.

$GT’s weekly chart, a compelling setup is formingLooking at NASDAQ:GT ’s weekly chart, a compelling setup is forming. The stock has been carving out a cup-and-handle pattern since mid-2023, with the cup bottoming near $9 and the handle consolidating around $12. This is a textbook bullish continuation pattern, often preceding explosive moves. The 20-week SMA is sloping upward, supporting the trend, while the ADX is rising above 25, confirming strengthening momentum. However, the handle’s tight range between $11.80 and $12.40 is critical. A breakout above $12.40, especially with a weekly close above it, could target $15—measuring the cup’s depth added to the breakout point. Volume contraction in the handle is typical, but I’d want to see a surge on the breakout for conviction. Conversely, a drop below $11.80 could invalidate the pattern, with support at $10.50 (the 50-week SMA) as the next line of defense. Stochastic RSI is nearing overbought territory, so timing is crucial—overextension could lead to a pullback first. For swing traders, this is a watchlist candidate: go long on a confirmed breakout or short on a breakdown with clear stops. NASDAQ:GT ’s correlation with auto sector trends could also drive volatility, so factor that in!
WATCH OUT FOR PEPENo explanation needed; this is one of the top Meme coins to watching. I'm loading here looking for possibly 500 to 1000% with a 50% stop loss.

PEPE: A 10x or a Hopeless Meme?
The price is currently testing the support zone between 0.00000054 and 0.00000039, an area that has previously acted as a strong demand zone. A hidden bullish divergence is forming on the RSI (7), where the RSI is making lower lows while the price remains relatively stable, suggesting potential exhaustion of selling pressure. Additionally, the RSI is in oversold territory, reinforcing the likelihood of a rebound.
Optimal entry points are within the 0.00000054 to 0.00000039 range, where buyers may start stepping in. Alternatively, a structural shift in lower timeframes could provide further confirmation before entering. The upside potential is significant, with the primary target set at the all-time high (ATH) of 0.0000283, presenting a high risk-reward opportunity.
👨🏻💻💭 This setup presents a solid case for a potential bounce. Are you prepared for the next move?
__
The information and publications within the 3Commas TradingView account are not meant to be and do not constitute financial, investment, trading, or other types of advice or recommendations supplied or endorsed by 3Commas and any of the parties acting on behalf of 3Commas, including its employees, contractors, ambassadors, etc.

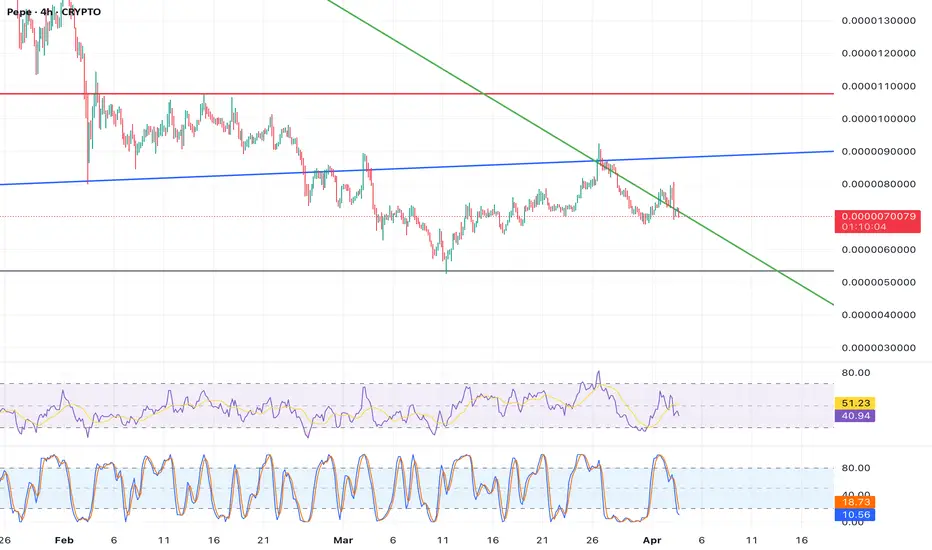
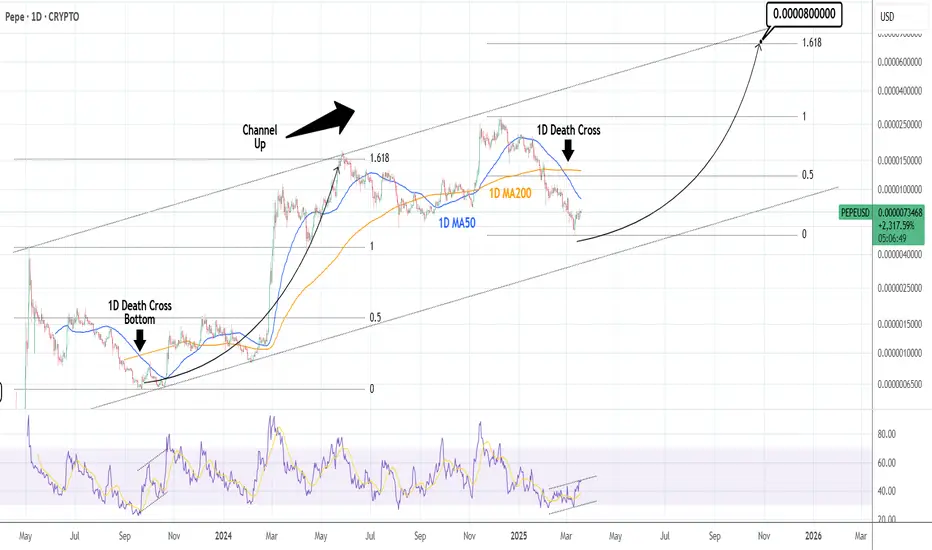
PEPEUSD: Bottom highly likely priced. Target 0.00008.Pepe turned neutral on its 1D technical outlook (RSI = 46.389, MACD = 0.000, ADX = 26.088) as it has been on a small short term bounce but still limited under the 1D MA50. The latter is the level to break as it has been the Resistance of this bearish wave of the 2 year Channel Up with two rejections on Jan 17th and Jan 2nd. The recovery on the 1D RSI is a strong sign of a bottom, much like September 20th 2023. Technically that took place on a 1D Death Cross, a formation we completed 4 weeks ago. The bullish wave that started then, hit the 1.618 Fibonacci extension. Long term trade is buy, TP = 0.00008.
## If you like our free content follow our profile to get more daily ideas. ##
## Comments and likes are greatly appreciated. ##

PEPE bottomed and is targeting 0.0000795PEPE / PEPEUSD is trading inside a Channel Up and this week's green candle suggests that we've most likely priced the bottom.
Especially since the 1week RSI hit the bottom of its Channel Down.
The Channel's first bullish wave hit the 1.618 Fib extension.
Buy and target 0.0000795
Follow us, like the idea and leave a comment below!!

$PEPE $BOBO $MUMU $SNIBBU $ETH please i beg u to buy these coins when eth reaches 5-7k these coins will go to billions i stand on that and just wait and load up

$Pepe Timeframe: D
An upward correction is in progress, but wave may lead to a sharp decline. Numerous factors indicate that this cryptocurrency is already in a bear market phase.
#PEPE

PEPUSD POTENTIAL SETUP
**Overview:**
PEPEUSD is currently trading within a descending channel, respecting key supply and demand zones. The market is approaching a critical decision point that could determine the next major move.
**Key Levels:**
🔹 **Support:** 0.00000719 - Strong demand zone where price has recently bounced.
🔹 **Resistance:** 0.00000850 - Key breakout level to watch.
🔹 **Major Target:** 0.00001031 - Potential upside target if bullish momentum takes over.
**Analysis:**
- The price is currently in a downward structure but has shown signs of potential reversal from the demand zone.
- A **break above the 0.00000850 zone** could confirm bullish momentum, making it a strong area to accumulate more positions.
- If the price fails to break this resistance, we may see further consolidation or a continuation of the downtrend.
**Trade Plan:**
📌 **Bullish Scenario:**
- Wait for a confirmed breakout and retest of 0.00000850 before entering long.
- Target **0.00001031** with a proper risk-reward setup.
📌 **Bearish Scenario:**
- If price rejects resistance, short opportunities could be considered with a stop above the resistance.
- Target the previous low at **0.00000719** for a potential retracement.
*Final Thoughts:**
This setup requires patience and confirmation. Always manage risk accordingly and wait for clear price action signals before executing trades. 🚀📊

Time to buyMost people are afraid to buy when something drops but buy when something has gone up already.
But the idea is to buy low and sell high.
This would seem like the better time to buy.

PEPE - Could See A 70%+ HaircutThis market cycle has by far been the most complex for the timings of altcoins.
It would appear that the "good ol days" where they all moved together and you can buy any coin and make profit are in the past.
There have been quite a few coins that have had very bearish phases, long downtrends late into the cycle; moving against the overall market.
Meme coins did very well early on which was very appetising for pump chasers, but more recently they have been taking a battering.
PEPE is a good example of this.
Its perhaps not apparent on a log chart, but the slump from the highs is already down 70%+.
Thats not as bad as some other top flight meme coins but its still a lot.
PEPE has been printing a long term ascending wedge.
That is a bearish fractal pattern.
I think this might just get back to the retracement Golden Window (0.618-0.786).
If it does then it will be a 90% crash from the highs.
This isn't becuase I'm some saddo bear that hates crypto.
I am bullish on many top coins as well as some more dangerous ones in technical positions.
But you really have to pick them.
This is the cycle where many pump chasers get smashed.
The same goes for those who follow FA gurus. If you can't read a chart and make technical decisions; you're asking for trouble.
Not advice.

$PEPE Elliott Wave Theory OutlookConsolidation sideways and slightly up for over a year. A big move is on the horizon. From my Analysis a wave 3 of (3). I don't recommend longs as liquidations hunts can occur. One of the few Alt tokens outperforming $BTC. Twitter and Elon love the 🐸.

Will PEPE Pump or Dump Next?PEPE is mirroring its pre-pump structure from last year:
1️⃣ Both times, it spent months forming a large symmetrical triangle.
2️⃣ It followed the exact same 1-7 point structure.
3️⃣ After breaking out, both saw a major pullback.
4️⃣ The drop went below the Fibonacci 1.272 retracement level.
The recent crash perfectly touched the triangle’s upper boundary (descending trendline).
Now, we’re watching to see if the 1.272 level holds.
A retest of the descending trendline is possible, shaking out weak hands and cleaning up liquidity.
If BINANCE:PEPEUSDT bounces off the descending trendline, it could be a solid entry point.
But as always, set a stop-loss in case the drop continues.
If history repeats, the last cycle saw about a 3x pump—that’s the visible potential upside.
Honestly, in crypto, a 3x isn’t eye-catching.
But considering PEPE is one of the few meme coins that reached mainstream attention, its liquidity-grabbing power in an altcoin bull run could be massive.
🔴 for more future script "guesses" like this!
🔥 I've dropped another 2 analyses for the 2025 altseason on the right hand side if you're using computer, and scroll down a bit to see the link if you're using mobile.

PEPE Deep dive before pumping? To what price?CRYPTOCAP:PEPE Script: A potential deep dive might be on the horizon before the next pump.
Right now, it’s forming a structure that looks a lot like the pattern we saw from March to May, which I’ve marked as points 1 to 7.
Both of these structures showed up after breaking out from the near-end of a symmetrical triangle.
Currently, we’re sitting at point 6.
Using Fibonacci retracement, we can estimate how deep the dip might go.
Last time, it reached Fib 1.618. If history repeats itself, PEPE could pull back to around 0.00009485.
This potential drawback would also break the uptrend line, which could shake market confidence and flush out weaker hands—perfect for accumulating liquidity to fuel a future price surge.
I’ve already set a buy order at this level, just in case this scenario plays out.
Of course, this is just one potential script among many. I’ll share more as they unfold.
Follow me for more insights and updates! 😊

Update PephehPepe Analysis Update
Unfortunately, the fifth wave of Pepe was smaller than I thought, but the good is that the first large wave ended and is now in the second wave.
That is, Pephea has earned about 14,000 percent since entering the market, and its third wave should at least give the same amount.
Ppee's best key support
0.000006658 is 0.78 fibonachi but my opinion breaks down
0.000004352 around
And its biggest support 0.000001741
Had to wait for the next waves to make the puzzle complete

Frogonomics...If there is going to be an alt season the big winners are going to be all memes - expect crazy amounts of $ to flow into top memes.

PEPEUSD: 10 month Channel Up bottomed. Target 0.00045.Pepe is still bearish on its 1D technical outlook (RSI = 42.958, MACD = 0.000, ADX = 31.752) despite today's rise as the price remains close to the bottom of the 10 month Channel Up. Still, the 1D RSI just got oversold and immediately rebounded, which is what happened on the August 5th 2024 bottom that gave rise to the new bullish wave. Both prior bullish waves rose by +336.78%. A crossing over the 1D MA50 would be a validated signal but even now, buying is worth the Risk against the potential Reward, which is the +336.78% that we're targeting (TP = 0.000045).
## If you like our free content follow our profile to get more daily ideas. ##
## Comments and likes are greatly appreciated. ##

PEPE enlarging quickly from here :):Loving the 4 hr bullish divergence likely quick squeeze up incoming
