US100 BEARISH FLAG|SHORT|
✅US100 is trading in a
Strong downtrend and
The price has formed a
Bearish flag pattern so
And on top of that the
Horizontal resistance
Of 20,000 is ahead so
We are super bearish
Biased and IF we see a
Bearish breakout we
Will be expecting
A further move down
SHORT🔥
✅Like and subscribe to never miss a new idea!✅
Disclosure: I am part of Trade Nation's Influencer program and receive a monthly fee for using their TradingView charts in my analysis.
NAS100 trade ideas

NSDQ100 INTRADAY Bearish oversold bounce back
Key Support and Resistance Levels
Resistance Level 1: 19972
Resistance Level 2: 20127
Resistance Level 3: 20658
Support Level 1: 19124
Support Level 2: 18732
Support Level 3: 18100
This communication is for informational purposes only and should not be viewed as any form of recommendation as to a particular course of action or as investment advice. It is not intended as an offer or solicitation for the purchase or sale of any financial instrument or as an official confirmation of any transaction. Opinions, estimates and assumptions expressed herein are made as of the date of this communication and are subject to change without notice. This communication has been prepared based upon information, including market prices, data and other information, believed to be reliable; however, Trade Nation does not warrant its completeness or accuracy. All market prices and market data contained in or attached to this communication are indicative and subject to change without notice.

Hanzo | Nas100 15 min Breaks Structure – Bearish the Next Move🆚 Nas100 – The Way of the Silent Blade
⭐️ We do not predict—we calculate.
We do not react—we execute.
Patience is our shield. Precision is our sword.
🩸 market is a battlefield where hesitation means death. The untrained fall into traps, chasing shadows, believing in illusions. But we are not the crowd. We follow no signal but the one left behind by Smart Money. Their footprints are our way forward.
🩸 Bearish Structure Shatters
Key Break Confirms the Path – 19650 Zone
our reversal always at key level
even a reversal area is well studded
reasons
Liquidity Swwep
liquidity / choch
key level / multi retest before
weekly / monthly zone
🔻 This is the threshold where the tides shift. If price pierces this level with authority, it is no accident—it is designed. The liquidity pool above has been set, and the institutions will claim their prize. Volume must confirm the strike. A clean break, a strong push, and the path is set.
Watch the volume. Watch the momentum. Strike without doubt

Hanzo | Nas100 15 min Breaks Structure – Confirm the Next Move🆚 Nas100 – The Way of the Silent Blade
⭐️ We do not predict—we calculate.
We do not react—we execute.
Patience is our shield. Precision is our sword.
🩸 market is a battlefield where hesitation means death. The untrained fall into traps, chasing shadows, believing in illusions. But we are not the crowd. We follow no signal but the one left behind by Smart Money. Their footprints are our way forward.
🩸 Bullish Structure Shatters -
Key Break Confirms the Path – 19880
reasons
Liquidity Swwep
liquidity / choch
key level / multi retest before
weekly / monthly zone
🩸 Bearish Structure Shatters
Key Break Confirms the Path – 19820 Zone
our reversal always at key level
even a reversal area is well studded
reasons
Liquidity Swwep
liquidity / choch
key level / multi retest before
weekly / monthly zone
🔻 This is the threshold where the tides shift. If price pierces this level with authority, it is no accident—it is designed. The liquidity pool above has been set, and the institutions will claim their prize. Volume must confirm the strike. A clean break, a strong push, and the path is set.
Watch the volume. Watch the momentum. Strike without doubt
NASA100Considering the resistance levels and seeing the divergence, return to the previous support level


NDX-Market fall is related to the trendline breakDid you know this market geometry, symmetry:
When a (strong) trendline is broken, the market will fall equal distance or more from the trendline as from the peak to the breakpoint. I have shown example of Nasdaq from the past.
This is also true for the reverse, a falling trendline break can predict the upside target
Hope this is useful in your trading
What it means is you might see a small upside from here, but since its already broken the trendline, it will trap the buyers and then do a hard U turn to the downside. I would wait for a bullish pattern to develop before going in long. Be careful of traps!

NAS100 Bullish Trend H4 confirms the change of character to bullish. Long here. Turn to bearish if the price is below 19.100.
The next target is 20.400–20.600.
Good luck!

Order Block @19918 |Sell SignalPrice is in an overall downtrend, it was retracing when it created a change of character indicating the end of the retracement. It then came back to mitigate the order block that lead to the change of character but didn't give any confirmation for entry so now I'm waiting for price to give me a possible liquidity sweep and giving a sell confirmation.

NASDAQ SHORT IDEA Update on previous analysis ... Still looking at it for the anticipated move... Drop a comment tell me what you think


Nasdaq 100 Technical Outlook – Is a Major Reversal in Play?🔍 Market Overview:
The Nasdaq 100 (NDX) has been in a strong downtrend, but recent price action suggests a potential bullish reversal from a key demand zone. As of now, price is testing critical resistance levels, and a breakout could lead to a significant rally.
📌 Key Levels to Watch:
🔹 Support: 19,433 – 19,500 (Strong demand zone) 🟠
🔹 Resistance 1: 20,710 (Breakout target) 🔵
🔹 Resistance 2: 22,091 (Major supply zone) 🔵
📈 Bullish Scenario:
If price holds above the 19,433 support level and breaks past 20,710, we could see a strong move toward 22,091. Volume confirmation and momentum indicators will be key to validating the bullish continuation.
📉 Bearish Scenario:
Failure to hold above 19,433 could signal further downside, possibly retesting lower support levels below 19,250.
🚀 Trading Plan:
✅ Long above 20,710 with targets at 21,500 and 22,091.
❌ Stop-loss below 19,433 to minimize risk.
💬 What’s your outlook on NDX? Will we see a breakout or another rejection? Drop your thoughts in the comments! 👇🔥

NASDAQ: 4H MA50 broke. Time for a full recovery.Nasdaq is still bearish on its 1D technical outlook (RSI = 39.669, MACD = -426.120, ADX = 56.837) but crossed above its 4H MA50. The last time a bearish wave of this Channel Down crossed above the 4H MA50 was on August 9th 2024. It was achieved again after an oversold 1D RSI bounce and initially hit the 0.786 Fibonacci level and then peaked on the 1.382 Fib extension. The trade is long, TP1 = 21,500 and TP2 = 23,400.
## If you like our free content follow our profile to get more daily ideas. ##
## Comments and likes are greatly appreciated. ##

Hanzo | Nas100 15 min Breaks Structure – Confirm the Next Move🆚 Nas100 – The Way of the Silent Blade
⭐️ We do not predict—we calculate.
We do not react—we execute.
Patience is our shield. Precision is our sword.
🩸 market is a battlefield where hesitation means death. The untrained fall into traps, chasing shadows, believing in illusions. But we are not the crowd. We follow no signal but the one left behind by Smart Money. Their footprints are our way forward.
🩸 Bullish Structure Shatters -
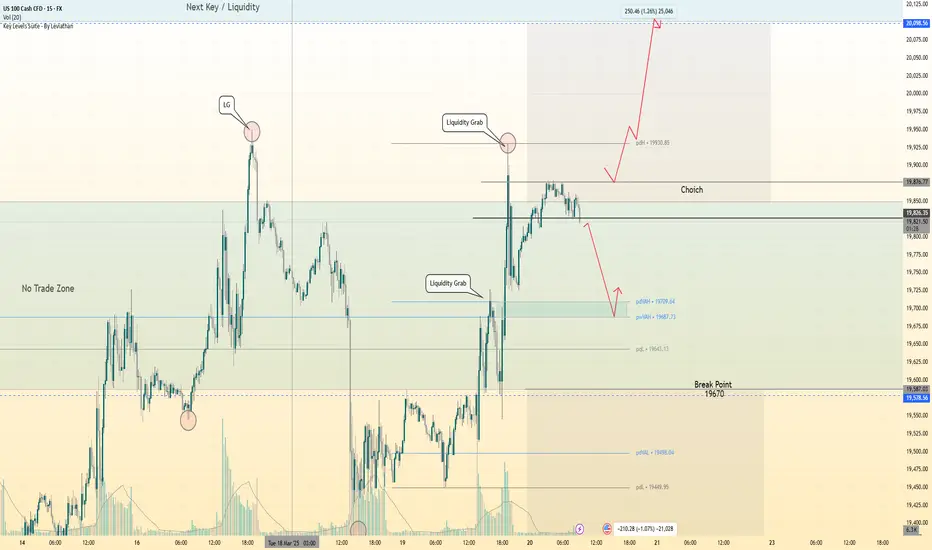
Key Break Confirms the Path – 19670
reasons
Liquidity Swwep
liquidity / choch
key level / multi retest before
weekly / monthly zone
🩸 Bearish Structure Shatters
Key Break Confirms the Path – 19530 Zone
our reversal always at key level
even a reversal area is well studded
reasons
Liquidity Swwep
liquidity / choch
key level / multi retest before
weekly / monthly zone
🔻 This is the threshold where the tides shift. If price pierces this level with authority, it is no accident—it is designed. The liquidity pool above has been set, and the institutions will claim their prize. Volume must confirm the strike. A clean break, a strong push, and the path is set.
Watch the volume. Watch the momentum. Strike without doubt

NASDAQ 100: Moon Mission or Reality Check? Ah, the NASDAQ 100—our favorite rollercoaster 🎢 where tech dreams are either made ✨ or brutally crushed 😵💫. Right now, it’s hovering around 19,500, and traders are debating: "Is this the launchpad to new highs or just a dead-cat bounce in disguise?" 🐱💀
Let’s break it down 👇
🚀 The Bullish Hopefuls: "We're Going to Valhalla, Boys!"
✅ Rebound Mode ON 🎯: After a nasty selloff, the market has found some footing and is showing signs of recovery 📈. Maybe the worst is over? (Yeah, sure, we've heard that before... 🙃)
✅ Fed to the Rescue? 🏦: With the FOMC meeting on deck, traders are hoping for some dovish magic dust ✨ to send tech stocks flying again. Because why rely on solid fundamentals when you have the Fed, right? 🤡
😨 The Bearish Doom-Sayers: "Brace for Impact!"
❌ Big Tech = Too Crowded 🚶♂️🚶♂️🚶♂️🚶♂️: Asset managers are side-eyeing Big Tech, calling it "overcrowded" 🙄. Translation? Expect a nasty rug pull soon.
❌ Healthy Correction... or the Start of Something Worse? 🚑: The S&P 500 dropped 10%, the NASDAQ fell 11%, and Treasury Secretary Scott Bessent is calling it a "healthy correction" 🤡. Yeah, just like how falling down the stairs is a “healthy adjustment” for your spine.
🤔 The Fence-Sitters: "We're Just Watching the Chaos 🍿"
🔮 Multiple Futures Await 🔮: Analysts are juggling four possible scenarios for the NASDAQ—ranging from "moon mission" 🚀 to "welcome to the abyss" 🕳️. Basically, flip a coin.
So... Where Are We Headed? 🤷♂️
Are we strapping in for another ride to the stratosphere 🚀, or is this just a perfectly orchestrated bull trap 🐂🔫? Either way, buckle up, folks—volatility is the only guarantee 🎢😵💫.
💬 What do you think? Drop your thoughts below! 👇🔥
(Disclaimer: This isn't financial advice. Do your own research before yeeting into the market. 🚀📉)

Hanzo | Nas100 15 min Breaks Structure – Confirm the Next Move🆚 Nas100 – The Way of the Silent Blade
⭐️ We do not predict—we calculate.
We do not react—we execute.
Patience is our shield. Precision is our sword.
🩸 market is a battlefield where hesitation means death. The untrained fall into traps, chasing shadows, believing in illusions. But we are not the crowd. We follow no signal but the one left behind by Smart Money. Their footprints are our way forward.
🩸 Bullish Structure Shatters -
Key Break Confirms the Path – 19570
reasons
Liquidity Swwep
liquidity / choch
key level / multi retest before
weekly / monthly zone
🩸 Bearish Structure Shatters
Key Break Confirms the Path – 19450 Zone
our reversal always at key level
even a reversal area is well studded
reasons
Liquidity Swwep
liquidity / choch
key level / multi retest before
weekly / monthly zone
🔻 This is the threshold where the tides shift. If price pierces this level with authority, it is no accident—it is designed. The liquidity pool above has been set, and the institutions will claim their prize. Volume must confirm the strike. A clean break, a strong push, and the path is set.
Watch the volume. Watch the momentum. Strike without doubt

NQ: FED's Day... a big dayGood day!
Big day today! Today's FED is one of the most important ones this year.
Does the Fed bend the knee to Trump and print free money and rate cuts ( for the next meetings, not this one) or not? The Conference will be very relevant to watch.
Market is looking for a relief sign; otherwise, NQ will drop heavenly. Only precaution here is that many large funds and corporation are still holding from above and their pants are down right now or under the water. So there is a possibility that, even with no hint from the FED, they will push the price up (yellow box) to liquidate their positions and sell from above. This will be short live up move. Hence trade safely and keep in mind this possibility.

Nas100Expecting to see a short fall here for Nas100. We have a 1:3 R:R with this setup and it is based off the 3 minute timeframe.

NAS100 bias Overall TRend is bearish clearly
4hr FTB happens
now once 15 FTB happens going short in it target 4h low.

BUYGod First
Minimum Risk Maximum Reward
Action Backed Believe
# faith, strategy, and execution all in one #

NAS100 Update - FED IR Decision TodayHow I see it:
BIG PIVOT AREA FOR NASDAQ BETWEEN
19960.00
&
19112.00
Breakout Catalyst - Pending Interest Rate Decision:
If there is any "WISPER" of further rate cuts this year,
"IT WILL BE POSITIVE FOR STOCKS"
Thank you for taking the time to study my analysis

NASDAQ LONGNasdaq 4h 61.8 fib level
Rising channel
bullish movement upwards
Use proper risk management

Nasdaq Elliott wave study … math study ..
Refined Elliott Wave Count (Higher Degree)
Let’s re-evaluate the larger wave structure with more precision by focusing on the price action from late 2024 to mid-March 2025:
Wave 1 (Impulsive):
Start: The low around late 2024 appears to be near 18,250 (approximated from the chart’s early price action).
End: The first significant high is around 19,500, which occurred in early January 2025.
Length: 19,500 - 18,250 = 1,250 points.
This move up is Wave 1 of the higher-degree impulsive wave.
Wave 2 (Corrective):
Start: 19,500.
End: The pullback to around 18,750 (a low in mid-January 2025).
Retracement: 19,500 - 18,750 = 750 points, which is a 60% retracement of Wave 1 (1,250 × 0.618 = 772 points). This is a deep but acceptable retracement for Wave 2, as Wave 2 can retrace up to 61.8% of Wave 1 without invalidating the count.
Wave 2 appears to have completed around 18,750.
Wave 3 (Impulsive):
Start: 18,750.
End: The high at 21,750, which occurred in early March 2025.
Length: 21,750 - 18,750 = 3,000 points.
Fibonacci Extension: Wave 3 often extends to 1.618 or 2.618 times the length of Wave 1.
1.618 × 1,250 = 2,022.5 points.
From the Wave 2 low: 18,750 + 2,022.5 = 20,772.5.
2.618 × 1,250 = 3,272.5 points.
From the Wave 2 low: 18,750 + 3,272.5 = 22,022.5.
The actual Wave 3 length (3,000 points) is very close to the 2.618 extension (3,272.5 points), which is typical for Wave 3 in a strong trending market like the Nasdaq 100. This confirms that the high at 21,750 is likely the end of Wave 3.
Wave 4 (Corrective):
Start: 21,750.
Current Price: 19,490.7 (as of March 19, 2025).
Retracement Levels:
23.6% of Wave 3: 21,750 - (3,000 × 0.236) = 21,750 - 708 = 21,042.
38.2% of Wave 3: 21,750 - (3,000 × 0.382) = 21,750 - 1,146 = 20,604.
50% of Wave 3: 21,750 - (3,000 × 0.5) = 21,750 - 1,500 = 20,250.
61.8% of Wave 3: 21,750 - (3,000 × 0.618) = 21,750 - 1,854 = 19,896.
Current Position: The price at 19,490.7 has retraced slightly beyond the 61.8% level (19,896), which is a deep retracement but still within the acceptable range for Wave 4. In Elliott Wave theory, Wave 4 can retrace up to 78.6% of Wave 3 in some cases, especially in indices:
78.6% of Wave 3: 21,750 - (3,000 × 0.786) = 21,750 - 2,358 = 19,392.
The price is very close to the 78.6% retracement (19,392) and is also testing the lower boundary of the ascending channel at 19,425, providing strong confluence for a potential Wave 4 low.
Wave 5 (Projected Impulsive):
Wave 5 typically equals the length of Wave 1 or reaches a Fibonacci extension of the entire Wave 1-3 move.
Wave 1 Length: 1,250 points.
From the potential Wave 4 low at 19,490.7: 19,490.7 + 1,250 = 20,740.7.
0.618 Extension of Wave 1-3:
Wave 1-3 range: 18,250 to 21,750 = 3,500 points.
0.618 × 3,500 = 2,163 points.
From the Wave 4 low: 19,490.7 + 2,163 = 21,653.7.
1.0 Extension of Wave 1-3:
1.0 × 3,500 = 3,500 points.
From the Wave 4 low: 19,490.7 + 3,500 = 22,990.7.
Channel Target: The upper boundary of the ascending channel is around 22,250 (as marked on the chart), which aligns closely with the 0.618 extension target of 21,653.7 and suggests a realistic Wave 5 target in the 21,650–22,250 range.
2. Sub-Wave Structure of Wave 4 (A-B-C Correction)
Wave 4 is a corrective wave, typically unfolding in a three-wave A-B-C structure. Let’s break it down with more precision:
Wave A:
Start: 21,750.
End: The first significant low after the peak, which is around 20,276 (a previous support level marked on the chart).
Length: 21,750 - 20,276 = 1,474 points.
Wave B:
Start: 20,276.
End: The bounce to 20,833 (a minor high before the next decline).
Length: 20,833 - 20,276 = 557 points.
Retracement of Wave A: 557 / 1,474 = 37.8%, which is close to a typical 38.2% retracement for Wave B in an A-B-C correction.
Wave C:
Start: 20,833.
Current Price: 19,490.7.
Length So Far: 20,833 - 19,490.7 = 1,342.3 points.
Wave C Projections:
Wave C often equals Wave A: 1,474 points.
From the Wave B high: 20,833 - 1,474 = 19,359.
Wave C can extend to 1.618 × Wave A: 1,474 × 1.618 = 2,384.9 points.
From the Wave B high: 20,833 - 2,384.9 = 18,448.1.
Current Position: The price at 19,490.7 is very close to the 1:1 projection of Wave C (19,359), suggesting that Wave C (and thus Wave 4) is likely nearing completion. The deeper projection to 18,448 seems less likely unless the price breaks below the channel support at 19,425.
3. Confluence with the Ascending Channel
The ascending channel provides additional context for the Elliott Wave count:
Lower Channel Support: The price is currently testing the lower boundary of the channel at 19,425, which aligns closely with the 78.6% retracement of Wave 3 (19,392) and the 1:1 Wave C projection (19,359). This confluence of levels strengthens the case for a Wave 4 low.
Middle of the Channel: The middle of the channel (around 20,276–20,833) acted as resistance during the Wave B bounce and will likely be the first target for Wave 5.
Upper Channel Resistance: The upper boundary of the channel (around 22,250) aligns with the projected Wave 5 target, providing a realistic endpoint for the impulsive wave.
4. RSI Analysis in the Context of Elliott Wave
The RSI is currently at 44.2, down from a recent low of around 40.
Wave 4 and RSI: In Elliott Wave theory, Wave 4 corrections often coincide with RSI readings near oversold levels (30–40). The RSI dipping to 40 and now showing a slight uptick (with a green arrow) suggests that selling pressure may be exhausting, which is typical at the end of a Wave 4 correction.
Bullish Divergence: The RSI is starting to turn upward while the price is near support, indicating a potential bullish divergence. This supports the idea that Wave 4 is nearing completion and Wave 5 may begin soon.
5. More Accurate Scenarios
Bullish Scenario (Wave 5 Upward):
Confirmation: A bounce above 19,490.7, followed by a break above 20,276 (the Wave B high), would confirm the start of Wave 5.
Targets:
First target: 20,276–20,833 (middle of the channel and previous highs).
Second target: 21,653.7 (0.618 extension of Wave 1-3).
Final target: 22,250 (upper channel boundary and potential Wave 5 completion).
Wave 5 Sub-Waves: Wave 5 itself will likely unfold in five sub-waves, so we can expect some consolidation or minor pullbacks as it progresses toward the target.
Bearish Scenario (Deeper Correction):
Invalidation: If the price breaks below 19,425 (the lower channel support), it could invalidate the current Elliott Wave count. A break below 19,000 (the Wave 1 high) would confirm that the larger trend has shifted.
Alternative Count: If the move from 18,750 to 21,750 was a corrective wave (e.g., a larger Wave B), we could be in a larger Wave C down. Targets for a deeper correction would be:
19,000 (psychological support).
18,448 (1.618 extension of Wave A in the A-B-C correction).
18,250 (the start of the larger wave structure).
6. Key Levels to Watch
Support:
19,425 (lower channel boundary and current support).
19,392 (78.6% retracement of Wave 3).
19,359 (1:1 Wave C projection).
19,000 (psychological level and Wave 1 high; a break below this would invalidate the bullish count).
Resistance:
20,276 (Wave B high and middle of the channel).
20,833 (previous high within the channel).
21,653.7 (Wave 5 target based on 0.618 extension).
22,250 (upper channel boundary and final Wave 5 target).
7. Conclusion with More Accurate Details
Current Wave Position: The price is likely completing Wave 4 of a higher-degree impulsive wave, with the A-B-C correction nearing its end around 19,359–19,425. The deep retracement to 78.6% of Wave 3 (19,392) and the alignment with the lower channel support (19,425) provide strong confluence for a Wave 4 low.
Next Move: If the price holds above 19,425 and breaks above 20,276, Wave 5 is likely underway, targeting 21,653.7–22,250. The RSI showing signs of a reversal (bullish divergence) supports this scenario.
Trading Strategy:
Bullish: Enter a long position on a confirmed bounce above 19,490.7, with a stop-loss below 19,425. Target 20,276 as the first level, followed by 20,833 and 22,250.
Bearish: If the price breaks below 19,425, consider a short position with a stop-loss above 19,490.7, targeting 19,000 and potentially 18,448.
Risk Management: The deep retracement in Wave 4 suggests higher volatility, so use tight stop-losses and monitor price action closely for confirmation of the next wave.
