DOWN TREND CONTINUATION We created a daily fvg gap that might push price lower. a possible 9:30 manipulation higher will set the stage for lower price targeting Monday lows the fvg lower boundary is created by the Monday high this is also supported by the London section
NAS100 trade ideas

01-04-2025 _ Short Term Bullish Idea _ NAS100 M151- Divergence followed by Convergence.
2- No Divergence against.
3- One can expect pullback followed by continuation to the upside.

Nasdaq market analysis: 01-APRIL-2025Good morning! Happy New Day! Here's your daily Nasdaq market analysis. Learn, grow, and trade wisely.

THE SKY IS THE LIMITI am a nine to fiver so at times I don't have time for the charts, but like I said on a video yesterday, this week I am looking for Buys Buys and BUYS. Stay Tuned. Happy trading


Nas 3/31/2025I am working on looking at the bigger picture, and this is what I am seeing with NAS.
I do not have the percentages and what not correct on my GANN box just FYI, but that would be the zone I am watching. I think she may go a little higher, but then after that, there is a strong support line from August 2024 not far below, that I think she will continue to drop down too, and then decide which trend she want's to go for from there. lol
Yes, NAS is a girl to me.
She is too indecisive, not to be, lol

NAS100 Is Bullish! Long!
Take a look at our analysis for NAS100.
Time Frame: 9h
Current Trend: Bullish
Sentiment: Oversold (based on 7-period RSI)
Forecast: Bullish
The market is on a crucial zone of demand 19,181.5.
The oversold market condition in a combination with key structure gives us a relatively strong bullish signal with goal 19,921.0 level.
P.S
We determine oversold/overbought condition with RSI indicator.
When it drops below 30 - the market is considered to be oversold.
When it bounces above 70 - the market is considered to be overbought.
Disclosure: I am part of Trade Nation's Influencer program and receive a monthly fee for using their TradingView charts in my analysis.
Like and subscribe and comment my ideas if you enjoy them!

US100 BULLS ARE STRONG HERE|LONG
US100 SIGNAL
Trade Direction: long
Entry Level: 19,170.0
Target Level: 20,308.4
Stop Loss: 18,413.4
RISK PROFILE
Risk level: medium
Suggested risk: 1%
Timeframe: 9h
Disclosure: I am part of Trade Nation's Influencer program and receive a monthly fee for using their TradingView charts in my analysis.
✅LIKE AND COMMENT MY IDEAS✅


NAS100 - Stock market still in a downtrend?!The index is trading below the EMA200 and EMA50 on the 4-hour timeframe and is trading in its descending channel. If the index moves down, it will be clear that it is heading for further moves. At the channel ceiling, I could be close to the next sell-off.
As the new US tariffs are set to take effect on April 2, new evidence suggests that they may be less than the markets had expected. According to a recent report in the Toronto Star, Canada is likely to face the lowest level of tariffs, while Mexico, another member of the US trade agreement, is likely to face a similar situation. In addition, Trump’s recent statements about significant progress in controlling fentanyl (an industrial drug), are seen as a positive sign for improving trade relations.
In this regard, CNBC reported that VAT and non-tariff barriers will not be taken into account in calculating the tariff rate, or at least not fully. The main concern is that by threatening to impose a 25% tariff, Trump is actually preparing Canada and Mexico to accept higher rates than the current conditions. It seems that his goal is to impose the highest possible tariff level. This decision could be an incentive to increase tariff revenue to reduce taxes. Of course, such an approach is associated with high risks, since any level of tariffs can lead to retaliatory measures from trading partners.
In the case of Europe, tariffs imposed on American goods are higher than in other countries, but a large part of them relate to the automotive industry. Europe has previously announced that it is ready to reduce these tariffs. The question now is whether the EU will take a different approach than Mexico and Canada? That is, first impose higher tariffs and then negotiate to reduce them.
This scenario could ultimately benefit the US economy, as the bulk of its trade is with Mexico and Canada. Meanwhile, China remains a complex challenge, as it is the main target of Trump’s tariff policies. In addition, the US president recently proposed imposing tariffs on Venezuela, which could be a pretext for intensifying trade pressure on China. Polls show that 50% of the market expects new tariffs on China, which indicates the level of investor concern.
The European Union has reacted to the Trump administration’s decision to impose new tariffs on imported cars and expressed regret over the move. European Commission President Ursula von der Leyen has said the bloc will seek a negotiated solution to ease tensions, but she has also stressed that Europe’s economic interests will be protected against US trade policies.
The US credit rating has risen to a new low, according to a new report from Moody’s, which warns that tax cuts and trade tariffs could widen the country’s budget deficit.
Analysts at Goldman Sachs and Deutsche Bank say investors expect the effective tariff rate on all imports to be between 9% and 10%, although some analysts at Goldman Sachs have suggested a rate of 18%. However, inflation and exchange rate expectations point to lower figures.
If Trump’s promise of “reciprocal tariffs” is implemented, the effective tariff rate could be even lower than 5 percent, although this depends on whether the agricultural sector is also subject to tariffs. Some reports also suggest that non-tariff barriers may be completely ignored.
According to Deutsche Bank, it is very difficult to determine market expectations precisely. But if the tariff rate ultimately falls between 5 and 7.5 percent, markets are likely to react with more confidence. Otherwise, more volatility and turbulence in financial markets are expected.
At the beginning of the year, markets were in a positive and optimistic mood. The Republican victory in the election, the continuation of tax breaks and the possibility of new support packages were among the factors that reinforced this optimism.
However, factors such as the high US budget deficit, the deadlock in Congress and the high inflation rate have now challenged this optimism. Meanwhile, two important support tools that were effective in the past may no longer be as effective:
1. During Trump’s first term, the stock market was of particular importance to him. Even during the COVID-19 crisis, he constantly talked about the stock market and considered it part of his successes.
The term “Put Trump” meant that even if he made harsh statements, he ultimately acted in the market’s favor.
2. But now, in Trump’s second administration, he talks about “short-term pain” and “economic detoxification.” Tariff threats, reduced investment and policy uncertainty have caused the S&P 500 to fall 10% since February. Trump still considers the market important, but he is no longer as staunchly supportive of it as he used to be.
In addition, this week will include the release of a series of key economic data. Including:
• Tuesday: ISM Manufacturing PMI and JOLTS.
• Wednesday: ADP Private Employment Report
•Thursday: ISM services index and weekly jobless claims.
One of the big risks to the markets is that economic data remains weak while the ISM price sub-indices rise. Such a situation could signal a deflationary tailwind. In such a situation, even if the Federal Reserve moves to lower interest rates, it will still be difficult for the stock market to grow.

NASDAQ Bullish Reversal (Potential Tariff Resolution?) NASDAQ price action went through a massive correction with a drop from the top worth approx. 14%.
However after the passing of the latest FOMC Meeting, we may finally see a direction towards the resolution of widespread tariff based uncertainty across the macro economic landscape.
This presents us with a potential Reversal opportunity if we see the formation of a credible Higher High (given a potential proper break out) on the 4 HR and shorter timeframes.
Trade Plan :
Entry @ 20045
Stop Loss @ 19070
TP 0.9 - 1 @ 20923 - 21020


Good times still to roll on after correction.Bear flag forming at the edge of the channel. The flag pole came down with good volume and flag itself (consolidation) on decrease volume therefore good probability of more downside. If that happens that could create a Wycoff spring and resume the current trend.

NASDAQ 100 IndexThe price has already dropped to the support line of the inner channel (in light blue), which is at one standard deviation.
If this support line is also broken, the next support level is the outer channel (in yellow), which is at two standard deviations.
(Logarithmic price axis, channel starting from 2008)

NAS100 Technical Analysis🔹 Trend Overview:
Nas100 initially showed signs of recovery with some bullish momentum. However, in the last three days of the week, the market sentiment shifted, breaking key support zones at 19,880.00, 19,400.00, and 19,151.00. This drop was driven by growing uncertainty surrounding U.S. trade policy and a more pessimistic inflation outlook.
🔹 Key Levels:
📈 Resistance: 19,400.00
📉 Support: 19,151.00 – If broken, price may drop further.
🔹 Market Structure:
🚀 Bullish scenario: Rejection of 19,151.00 & break of 19,400.00 → Retest → Target higher levels.
⚠️ Bearish scenario: Break of 19,151.00 → Drop to 18,796.10 → Further decline if broken.
📌 Risk Management: Wait for confirmation of breakout or rejection before entering trades.

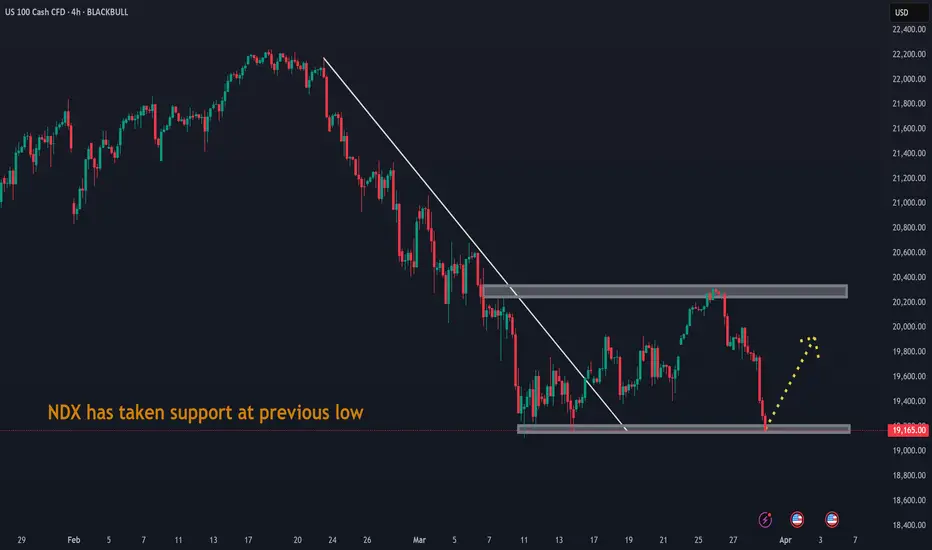
NDX has taken support at previous lowNDX has taken support at previous low. It may retrace from this support.
Nasdaq High Impact Analysis (Stock Market Crash)we are looking at a stock market crash.
high valuations of tech companys (nvidia, apple, microsoft, tesla etc)
a synthetic covid scenario, same news, same playouts, same situations playing out.
1995 - 2001 dot.com bubble playing out
we projecting a bottoming of 10 000
we projecting a high of 30 000
the whole scenario is re balancing the tech sector
alot more downward pressure before we see a bottom / buy the dip kind of playout.

How I Traded A FULL Multi-Timeframe Wave - AND got PAIDThis week, I tracked NASDAQ from a technical + psychological level most traders avoided… but I saw the opportunity 🔎
While others sat on the sidelines calling it “too choppy,” I:
✅ Identified Wave 5 structure on the 4H + 1H timeframes
✅ Mapped out entries using price action + liquidity zones
✅ Held through 6+ rejections at resistance
✅ Executed with discipline, not emotion
✅ Took partial profits, protected capital
✅ Watched price explode — and I got my 💸
✅ Then wrapped the week with a real withdrawal
📚 KEY LESSONS I’M DROPPING FOR YOU:
📊 Technical Analysis = The "What"
→ Chart patterns, structure, liquidity zones, entries/exits.
🌍 Fundamental Analysis = The "Why"
→ News, interest rates, sentiment.
I stayed focused on the “what” — not the fear headlines.
💡 Liquidity Isn’t Noise. It’s a Signal.
Every rejection I held through was just price loading up.
I didn’t flinch. I let smart money do the work.
💥 Wave 5s test your strategy AND your patience.
I saw smaller TF Wave 5 complete before 4H — so I waited.
I didn’t FOMO back in — I planned for the pullback and possible short flip.
🧠 MINDSET WINS > CHART WINS
🧘🏽♀️ My biggest move this week?
I walked away with clarity — not just profit.
That’s trader growth.
💬 Final thoughts:
You don’t need 100 trades. You need 1 well-managed setup and a calm mind.
📲 Follow me to keep learning how to trade structure, not stress.

NAS100 Triangle Apex – Breakout or Breakdown ImminentBullish View:
• Price is forming higher lows and holding above the lower ascending trendline.
• A breakout above the upper descending trendline near 18,500 would confirm bullish
momentum.
• If the breakout is sustained, potential upside targets include 18,650 and 18,800.
Bearish View:
• Price has tested the lower support trendline and shown weakness near the apex of the
triangle.
• A breakdown below 18,100 would indicate bearish momentum and invalidate the ascending
structure.
• If the breakdown is sustained, potential downside targets include 17,950 and 17,700.

Short Day TradeTook a Short position at the daily EMA9
Entry: 18440
SL: 18690
TP 17950
Went short because today China reacted with a tariff increase on Trump action and Tesla does not take orders in China anymore. Was thinking about shorting Tesla but I decided to stick to the index.
Entry Level was choosen because I expected the price to touch the daily ema9 again (when I woke up it was way below it). The TP is just the intraday low which I expect to be hit again. The SL is a little high, thought about taking the premarket high but considered that this might be the SL for many shorts and it might hit at market open to erase some shorts from the market.
So the Risk Reward Ratio is bad for this trade. If I weren't so bearish for the market I probably would not have taken the trade
In my opinion the upstick of the market was just market manupulation by Trump (who should be impeached over this) and the uncertainty will bring the market much lower
I trade on the 4h chart, the 1h is just to see the progress.
I will close the trade before the market closes, no matter where it is.

Nasdaq LongNasdaq approaching previous yesterday's close, with a buyside liquidity that has to be sweeped before making it's continuation to the downside if indication to the downside is still present after this move up.

NASDAQ BuyPossible reverse to the upside, markets are very volatile and great opportunities to buy at a discount are there. Given the current political climate we could see unexpected large moves in short spaces of time. please exercise proper risk management and dont overtrade, and stick to your plan.

Maybe fast we VA V-shaped recovery in stocks refers to a very sharp and rapid decline in the market (or a particular stock or index), followed by an equally fast and strong rebound. If you look at a price chart, the movement resembles the letter “V”.
🔍 Key Characteristics:
📉 Rapid drop: Often caused by panic, crisis, or a major economic shock.
📈 Quick rebound: Recovery begins quickly after the bottom and moves upward with strong momentum.
⏱️ Short duration: The total period of decline and recovery is relatively brief.
💼 Investor sentiment: Confidence returns quickly, and buying pressure increases.
Im in 17.860 out 18,364 - SL in profit - 18.051
