US30: Bullish Breakout on the Horizon – Next Target 44,000? US30: Bullish Breakout on the Horizon – Next Target 44,000?
Since our last analysis, US30 has climbed +2.7%, rising from 39,300 to 40,400.
The price is nearing a breakout from a large bullish triangle, which could trigger an even bigger upward move.
After hitting a low of 36,500 on April 7, US

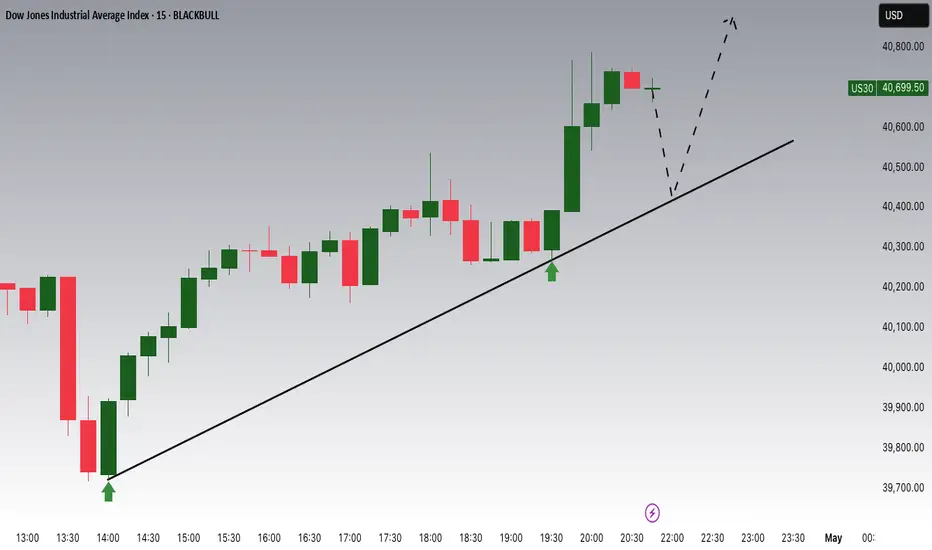
Dow Jones Potential UpsidesHey Traders, in today's trading session we are monitoring US30 for a buying opportunity around 40400 zone, Dow Jones is trading in an uptrend and currently is in a correction phase in which it is approaching the trend at 40400 support and resistance area.
Trade safe, Joe.
US30 Approaching Key Resistance Within Rising Channel:🧠 Chart Context & Overview
Chart Type: Candlestick
Time Frame: Appears to be Daily (based on price action and spacing of dates)
Current Price: ~$40,798.4
Indicators:
EMA 50 (Red): ~40,065.2
EMA 200 (Blue): ~41,475.6
Trend Structure: Ascending channel with higher highs and higher lows forming s

KEEP BUY ON US30!!!!!!Yesterday us30 completed +3,700pips from my entry point right now we have a liquidity sweep from the sell side am still going long from this point with my initial target at 40,701
JOIN AND ENJOY.........


US30 LOCAL SHORT|
✅DOW JONES is going up now
But a strong resistance level is ahead at 40,947
Thus I am expecting a pullback
And a move down towards the target of 40,314
SHORT🔥
✅Like and subscribe to never miss a new idea!✅
Disclosure: I am part of Trade Nation's Influencer program and receive a monthly

Everyone I am shorting DOW/US30Team I am shorting DOW, - MUST have stop loss the price could hit 40912-16 - but short slowly now, with STOP loss at 40960-65
Target 1 at 40750-40735 - reduce 30% volume
Target 2 at 40650-40600 - reduce 50% volume
Target 3 at 40550-740483 - remaining
Once the price reaches the first target, bring S

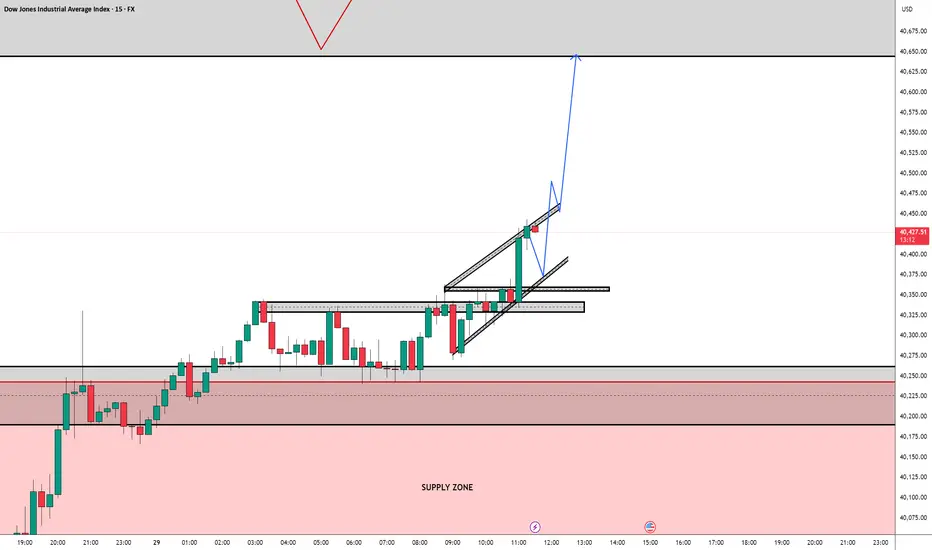
Trade Idea: Long Bias on US30I'm currently monitoring a potential long setup on US30. Price has broken out of a consolidation zone and is respecting an ascending channel. A breakout and retest pattern is forming around the upper trendline, with strong bullish momentum following a clean break of resistance near 40,350. I'm antic
Dow Jones Swing Short IdeaComing off All Time Highs after a trump victory rally it is time for an exhausted bull market to come back and find fair value for the real bulls that buy this. the amount of greed that's sits currently in this market is to dream of for bears, and their time haas come 34500 inbound...this target sho

US30 TO TANK DOWN!!!??Good day traders, unlike on US100 and S&P500 US30 is showing failure to break higher highs and is forming lower lows using or Golden zones, currently inside the range that i outlined we have a bearish market structure shift, i am expecting the market to tap into our FVG @40075.5 then tank down tho o

See all ideas
Displays a symbol's price movements over previous years to identify recurring trends.
Related indices
Frequently Asked Questions
Dow Jones Industrial Average Index reached its highest quote on Dec 4, 2024 — 45,105.1 GBP. See more data on the Dow Jones Industrial Average Index chart.
The lowest ever quote of Dow Jones Industrial Average Index is 15,253.5 GBP. It was reached on Aug 24, 2015. See more data on the Dow Jones Industrial Average Index chart.
Dow Jones Industrial Average Index is just a number that lets you track performance of the instruments comprising the index, so you can't invest in it directly. But you can buy Dow Jones Industrial Average Index futures or funds or invest in its components.