US30: Bullish Breakout on the Horizon – Next Target 44,000? US30: Bullish Breakout on the Horizon – Next Target 44,000?
Since our last analysis, US30 has climbed +2.7%, rising from 39,300 to 40,400.
The price is nearing a breakout from a large bullish triangle, which could trigger an even bigger upward move.
After hitting a low of 36,500 on April 7, US30 has been steadily rising, forming a strong triangle pattern. A breakout could start a powerful wave toward 44,000.
You may find more details in the chart!
Thank you and Good Luck!
❤️PS: Please support with a like or comment if you find this analysis useful for your trading day❤️
Previous analysis:
US30 trade ideas

Dow Jones Potential UpsidesHey Traders, in today's trading session we are monitoring US30 for a buying opportunity around 40400 zone, Dow Jones is trading in an uptrend and currently is in a correction phase in which it is approaching the trend at 40400 support and resistance area.
Trade safe, Joe.
US30 Approaching Key Resistance Within Rising Channel:🧠 Chart Context & Overview
Chart Type: Candlestick
Time Frame: Appears to be Daily (based on price action and spacing of dates)
Current Price: ~$40,798.4
Indicators:
EMA 50 (Red): ~40,065.2
EMA 200 (Blue): ~41,475.6
Trend Structure: Ascending channel with higher highs and higher lows forming since early April.
🔍 Technical Breakdown
📈 Trend Analysis
The price is moving within a rising parallel channel, respecting both upper and lower boundaries.
The recent bullish candles indicate momentum building towards a breakout or test of resistance.
🔄 EMA Confluence
Price is above the 50 EMA, showing short-term bullish momentum.
EMA 200 is acting as overhead resistance (~41,475), aligned with the top of the channel—a key decision zone.
📊 Support & Resistance Levels
Immediate Resistance: ~41,475 (EMA 200 & upper channel boundary).
Support Levels:
~40,065 (EMA 50)
~39,000 (mid-channel support zone)
~38,000 (lower channel boundary)
📌 Scenarios to Watch
✅ Bullish Case:
A clean breakout above the channel and the 200 EMA (~41,475) with strong volume could trigger a trend continuation toward:
42,500 – next psychological and historical resistance
Potentially higher if macro sentiment aligns
⚠️ Bearish Case:
Rejection at 200 EMA or the upper channel could lead to:
A pullback to the mid-channel zone (~39,800–40,000)
Further downside to retest the lower channel support (~38,000)
📅 Outlook
The chart currently supports a bullish bias within an uptrend structure, but the key resistance zone (41,475) must be broken decisively for confirmation. Watch for volume and candle structure near that level to assess breakout validity.

KEEP BUY ON US30!!!!!!Yesterday us30 completed +3,700pips from my entry point right now we have a liquidity sweep from the sell side am still going long from this point with my initial target at 40,701
JOIN AND ENJOY.........


US30 LOCAL SHORT|
✅DOW JONES is going up now
But a strong resistance level is ahead at 40,947
Thus I am expecting a pullback
And a move down towards the target of 40,314
SHORT🔥
✅Like and subscribe to never miss a new idea!✅
Disclosure: I am part of Trade Nation's Influencer program and receive a monthly fee for using their TradingView charts in my analysis.

Everyone I am shorting DOW/US30Team I am shorting DOW, - MUST have stop loss the price could hit 40912-16 - but short slowly now, with STOP loss at 40960-65
Target 1 at 40750-40735 - reduce 30% volume
Target 2 at 40650-40600 - reduce 50% volume
Target 3 at 40550-740483 - remaining
Once the price reaches the first target, bring STOP LOSS TO BE
NEXT week, I will be releasing a video on how I made 1000% profit in 4 weeks. I would love to share my strategy with the world.

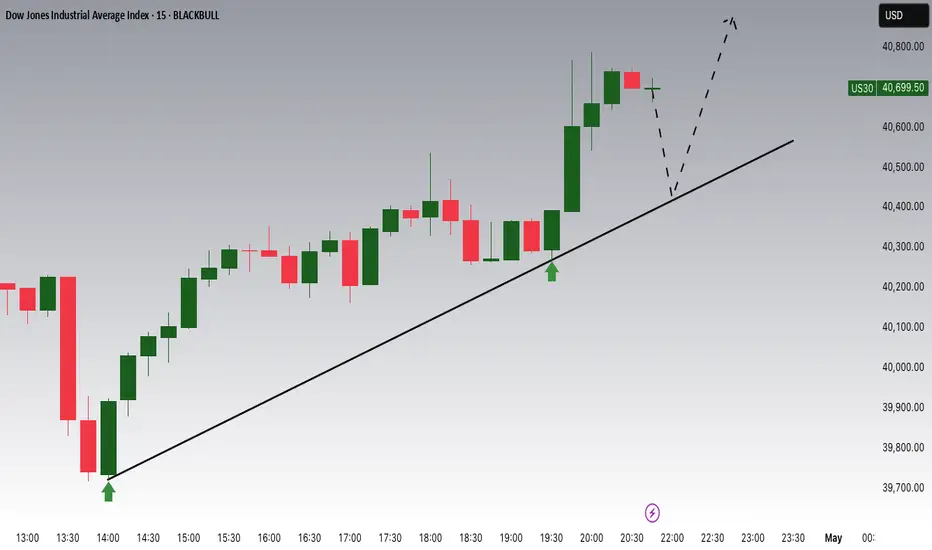
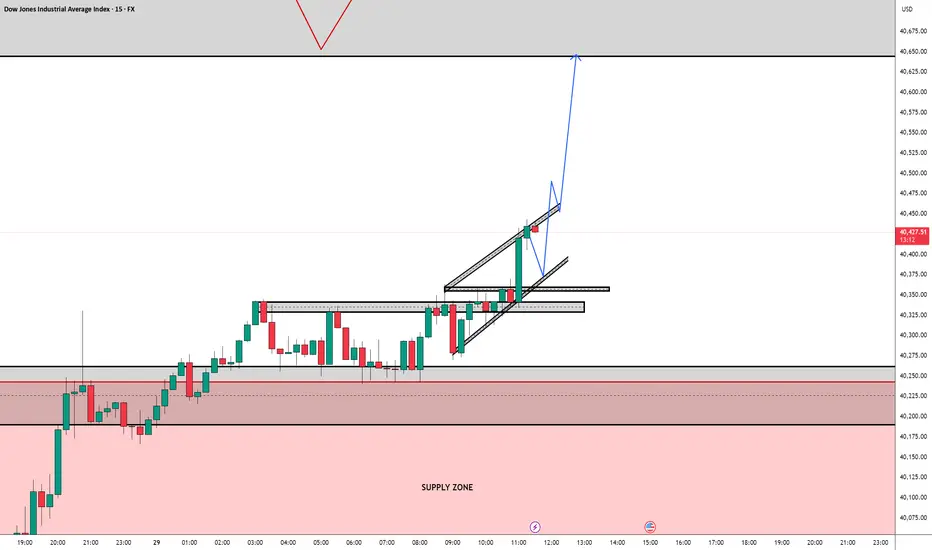
Trade Idea: Long Bias on US30I'm currently monitoring a potential long setup on US30. Price has broken out of a consolidation zone and is respecting an ascending channel. A breakout and retest pattern is forming around the upper trendline, with strong bullish momentum following a clean break of resistance near 40,350. I'm anticipating a brief pullback toward the breakout area (marked by the demand zone and retest block), followed by a continuation to the upside toward the 40,620–40,650 supply zone.
Trade Direction: Long
Entry Zone: 40,350–40,375 (on retest confirmation)
Target: 40,620–40,650
Invalidation: Clean break below 40,300
Context: Strong impulsive breakout + channel breakout with clear liquidity sweep below prior lows.
📌 Disclaimer: This is my personal analysis and should not be taken as financial advice. I’m still learning and refining my strategy — please do your own research and manage your risk carefully.
Dow Jones Swing Short IdeaComing off All Time Highs after a trump victory rally it is time for an exhausted bull market to come back and find fair value for the real bulls that buy this. the amount of greed that's sits currently in this market is to dream of for bears, and their time haas come 34500 inbound...this target should come through in the next 12month candle so its a long term leap trade.
DXY has been coming down too much, it's time to hit the kill switch on stocks and worry more on the dollar and all this inflation/tarriffs/war/ trump/ etc . DXY up = stocks down

US30 TO TANK DOWN!!!??Good day traders, unlike on US100 and S&P500 US30 is showing failure to break higher highs and is forming lower lows using or Golden zones, currently inside the range that i outlined we have a bearish market structure shift, i am expecting the market to tap into our FVG @40075.5 then tank down tho our sellside liquidity @39721.3
ENTRY:40075.5
SL: 40190.0
TP:39721.3

US30: Potential Bullish BreakoutUS30: Potential Bullish Breakout
US30 hit a low of 36,500 on April 7th. Since then, the price has been climbing steadily, forming a triangle pattern.
While a breakout could happen in either direction, I’m focusing on the bullish potential.
If US30 breaks above the triangle pattern, a strong upward wave could follow, possibly pushing the price toward 44,000.
You may find more details in the chart!
Thank you and Good Luck!
❤️PS: Please support with a like or comment if you find this analysis useful for your trading day❤️

US30 - Signs Point to Deeper Correction AheadBased on the chart of the Dow Jones Industrial Average, there appears to be a significant probability of a deeper correction from the current resistance levels. The index has formed what looks like a double top pattern near the 40,400 level, with notable resistance zones highlighted in blue on the chart. After recovering from the early April selloff that took the index down to around 36,600, the Dow has been unable to reclaim previous highs, instead facing rejection at these resistance levels. This price behavior, combined with the technical setup shown on the chart, indicates that we could see a more substantial pullback in the coming sessions if these resistance levels continue to hold.
Disclosure: I am part of Trade Nation's Influencer program and receive a monthly fee for using their TradingView charts in my analysis.

Potential Formation of a Triangle Pattern ObservedOn the daily timeframe, the Dow Jones movement currently presents two possible scenarios.
Under the black label, there is a potential formation of a triangle pattern, suggesting that the Dow Jones may enter a prolonged consolidation phase to complete wave B, with an expected range between 38,200 and 40,400.
However, under the red label (alternative scenario), a bearish triangle could be forming as part of wave X.

US30: Long Position Setup – Buyers Target Key ResistanceOverview:
The US30 index (Dow Jones Industrial Average) presents a clear long setup as price tests a crucial support zone, with potential bullish momentum targeting higher resistance levels. The chart's long position tool highlights a well-defined risk-to-reward framework.
Key Details from the Chart:
Long Position Tool Breakdown:
Entry Point: Price hovering near the support level, suggesting a strong buying opportunity.
Stop-Loss Level: Positioned slightly below the support to limit downside risk.
Take-Profit Target: Aiming for the next resistance zone above current price levels.
Support and Resistance Analysis:
Support Zone: A reliable level where buyers have repeatedly entered the market.
Resistance Zone: Above the take-profit target, where sellers might step in and stall upward movement.
Volume Insights:
Increased buying interest near the support level signals bullish sentiment. Volume profile analysis confirms strong participation at these levels.
Long Trade Plan:
Entry Strategy: Initiate long positions near the support level, ensuring confirmation with bullish candlestick patterns or a surge in buying volume.
Stop-Loss Placement: Secure the position with a stop-loss below the support level to protect against adverse price movements.
Take-Profit Levels: Target the resistance zone, maximizing potential gains while maintaining favorable risk management.
Market Sentiment:
The chart reflects growing buyer interest, with price action likely to push higher as long as the support zone holds. Traders should remain vigilant for reversal signals and manage positions accordingly.
Closing Thoughts: This long trade setup on US30 offers a well-balanced approach, allowing traders to capitalize on bullish momentum while minimizing risk. As always, patience and discipline are key to executing trades effectively.

DOW JONES Are you willing to bet against a 15 year pattern?Dow Jones (DJI) will close the month today with a massive rebound 1M candle after almost touching its 1M MA50 (blue trend-line). Since the October 2010 break above the 1M MA50, after the market recovered from the 2008 Housing Crisis, the 1M MA50 has been the ultimate long-term Buy Entry as it has always signaled rallies that ranged from +58% to +67%.
The 1M MA50 has also kept the index mostly within the 0.382 - 0.786 Fibonacci range (blue zone) of the multi-year Channel Up. Given also that the 1W RSI also reached in April its ultimate Buy Zone (green), we view this as the best long-term Buy Signal the index handed to us since the September 2022 bottom of the Inflation Crisis.
Since the Bullish Legs that followed have been fairly consistent on average, we expect another 58% rise minimum. Assuming a 'bad-case' scenario of being contained within the 0.786 Fib, then a 56000 long-term Target seems more than fair.
Are you willing to go against this pattern?
-------------------------------------------------------------------------------
** Please LIKE 👍, FOLLOW ✅, SHARE 🙌 and COMMENT ✍ if you enjoy this idea! Also share your ideas and charts in the comments section below! This is best way to keep it relevant, support us, keep the content here free and allow the idea to reach as many people as possible. **
-------------------------------------------------------------------------------
💸💸💸💸💸💸
👇 👇 👇 👇 👇 👇

US30 Rejected at Resistance – 24/04/2025 🧨 US30 Rejected at Resistance – 24/04/2025 🧨
📉 False Break Above 40k – Sellers Step In!
Price failed to sustain above the 40,000 psychological level and got rejected near 40,360, confirming that sellers are still active around the key 40,701 zone. We’re seeing a lower high forming after that pop 🚨.
🔍 Key Observations:
❌ Rejection at 40,360
📉 Lower high structure forming
🔻 Weak bounce and now pulling back under 39,500
📍 Support around 38,955 - watch closely
🎯 Trade Plan:
🔹 Bears in control short-term
⚠️ Watch 38,955 zone — if that breaks → 38,250 / 37,000 in play
💥 Short entries valid below 39,200 with tight risk
🚀 Bulls need a reclaim above 40,000 to regain control
🧠 Psych Tip: Don't FOMO into longs yet — wait for a reclaim or break structure short.

Us30 Upward or downward?In the 5-minute timeframe, you can sell at the top of the trading range and buy at the bottom of the trading range (by observing reversal candles and patterns).
Alternatively, you can wait for a breakout and enter in the direction of the breakout.
Be mindful of fake breakouts

Hanzo | US30 15 min Breaks – Confirm the Next Bullish Move🆚 US30 – Hanzo’s Strike Setup
🔥 Timeframe: 15-Minute (15M)
——————
💯 Main Focus: Bullish Breakout at 40500
We are watching this zone closely.
———
Analysis
👌 Market Signs (15M TF):
• Liquidity Grab + CHoCH at 40420
• Liquidity Grab + CHoCH at 39870
• Strong Rejections seen at:
➗ 39900 – Major support / Key level
➗ 40300 : 40400 – Proven resistance
🩸 Key Zones to Watch:
• 40200 – 🔥 Bullish breakout level X 3 Swing Retest
• 40550 – Strong resistance (tested 5 times)
• 40200 – Equal lows
• 40420 – Equal highs

Bearish drop off overlap resistance?Dow Jones (US30) is reacting off the pivot which has been identified as an overlap resistance and could drop to the 1st support.
Pivot: 40,653.80
1st Support: 39,356.30
1st Resistance: 41,490.90
Risk Warning:
Trading Forex and CFDs carries a high level of risk to your capital and you should only trade with money you can afford to lose. Trading Forex and CFDs may not be suitable for all investors, so please ensure that you fully understand the risks involved and seek independent advice if necessary.
Disclaimer:
The above opinions given constitute general market commentary, and do not constitute the opinion or advice of IC Markets or any form of personal or investment advice.
Any opinions, news, research, analyses, prices, other information, or links to third-party sites contained on this website are provided on an "as-is" basis, are intended only to be informative, is not an advice nor a recommendation, nor research, or a record of our trading prices, or an offer of, or solicitation for a transaction in any financial instrument and thus should not be treated as such. The information provided does not involve any specific investment objectives, financial situation and needs of any specific person who may receive it. Please be aware, that past performance is not a reliable indicator of future performance and/or results. Past Performance or Forward-looking scenarios based upon the reasonable beliefs of the third-party provider are not a guarantee of future performance. Actual results may differ materially from those anticipated in forward-looking or past performance statements. IC Markets makes no representation or warranty and assumes no liability as to the accuracy or completeness of the information provided, nor any loss arising from any investment based on a recommendation, forecast or any information supplied by any third-party.

My US30 Outlook For MondayFor now, my bias on US30 is bullish.
Based on the current price action and structure, I’m expecting continued buying pressure into the Supply Zones overhead.
I'll be following the bullish momentum carefully and will maintain a buy bias until further notice, while staying alert for any signs of weakness or reversal as we approach key resistance areas.
Just a reminder — I'm a regular guy who’s learning and improving every day in this trading journey. This is not financial advice — it’s simply my personal view based on my current analysis. Always do your own research and manage risk properly!

DOW JONES: The most critical 1D MA50 of all.Dow Jones is neutral on its 1D technical outlook (RSI = 52.914, MACD = -282.250, ADX = 30.751) but has completed 5 green 1D candles in a row, going for the all important Resistance test of the 1D MA50. This trendline has been intact since March 3rd and is on a crucial Resistance cluster as this is where the LH trendline from the ATH is. The 1D RSI is already on an Inverse H&S, which is a positive sign but we need to see a candle closing over the 1D MA50 to validate the restoration of the long term bullish trend. If succesful, we will turn long and target the ATH Resistance (TP = 45,000), which is also just under the 2.0 Fib extension.
## If you like our free content follow our profile to get more daily ideas. ##
## Comments and likes are greatly appreciated. ##

A deeper pullback will occur soon!Hello, traders
Based on the chart of the Dow Jones Industrial Average, there appears to be a significant probability of a deeper correction from the current resistance levels. The index has formed what looks like a double top pattern near the 40,400 level, with notable resistance zones highlighted in blue on the chart. After recovering from the early April selloff that took the index down to around 36,600, the Dow has been unable to reclaim previous highs, instead facing rejection at these resistance levels. This price behavior, combined with the technical setup shown on the chart, indicates that we could see a more substantial pullback in the coming sessions if these resistance levels continue to hold.

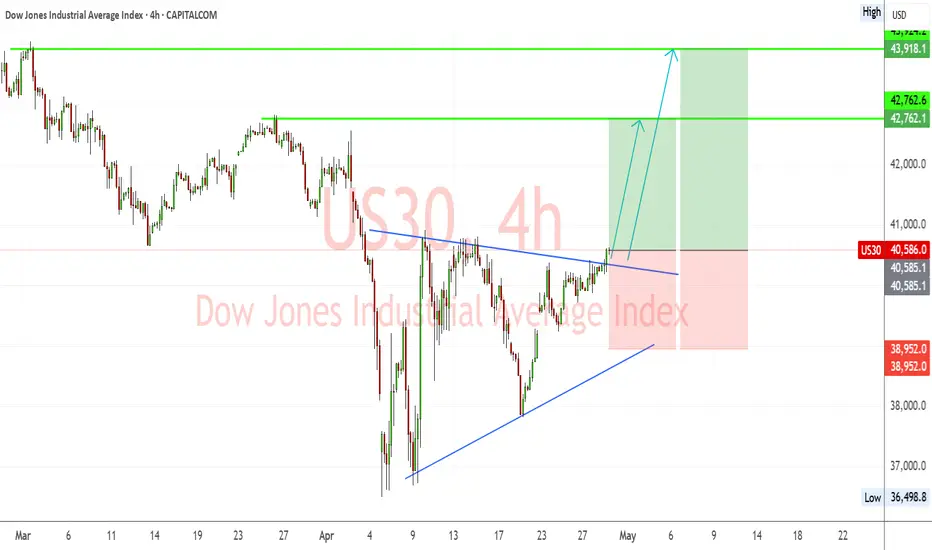
US30 Breakout from Symmetrical Triangle – Bullish Targets EyedUS30 (Dow Jones) has successfully broken out of a symmetrical triangle consolidation pattern, signaling a shift toward bullish momentum. The breakout is occurring after a strong recovery from April lows, with higher lows supporting upward price pressure.
🔹 Chart Structure:
Symmetrical triangle with a clean breakout above descending resistance.
Series of higher lows indicating accumulation.
Bullish breakout confirmed with price pushing above the 40,580 zone.
🔑 Key Levels:
Current Price: 40,586
Breakout Confirmation Level: 40,580
Immediate Resistance/TP1: 42,762
Major Resistance/TP2: 43,924
Support Zone: 38,950
Invalidation/Stop Level: Below 38,950
✅ Bullish Confluence Factors:
Breakout of symmetrical triangle pattern
Higher lows indicate bullish strength and accumulation
Momentum shift visible on lower timeframes
Positive correlation with improving US equity market sentiment
Anticipation of dovish Fed tone could boost equities
🧠 Fundamental Context:
Market is cautiously optimistic ahead of FOMC this week; dovish stance expected due to recent soft economic indicators.
Earnings season tailwinds and lower bond yields support index gains.
Ongoing political and tariff-related headlines may cause volatility, but technical breakout remains in focus.
💡 Trade Idea:
Bias: Bullish
Entry: On successful retest of 40,580 or continuation above 40,600
TP1: 42,762
TP2: 43,924
Stop Loss: Below 38,950
📌 Note: Watch for pullbacks to triangle resistance-turned-support. FOMC and US macro data releases midweek can impact momentum.