Potential declineDow Jones is currently struggling to reach 40,872. The index has been rising slowly daily, but the bullish move might decline if it cannot surpass the 40,872 barrier. The bearish move will be fulfilled if price action manages to remain under 40,800, stabilise below the 40,232 and 40,000. This is because of breaking out of the bullish trend and remaining outside and under the mentioned barriers, which will spearhead the likelihood of a downward trajectory.
The potential fall may target 39200 and 38900, which may also lead to the development of the right shoulder of the inverse head and shoulder pattern, potentially for a bullish rise. However, if price action fails to go down and also stabilises above the 40872, the index will likely continue rising into the 41,000 and 42,000s.
US30 trade ideas

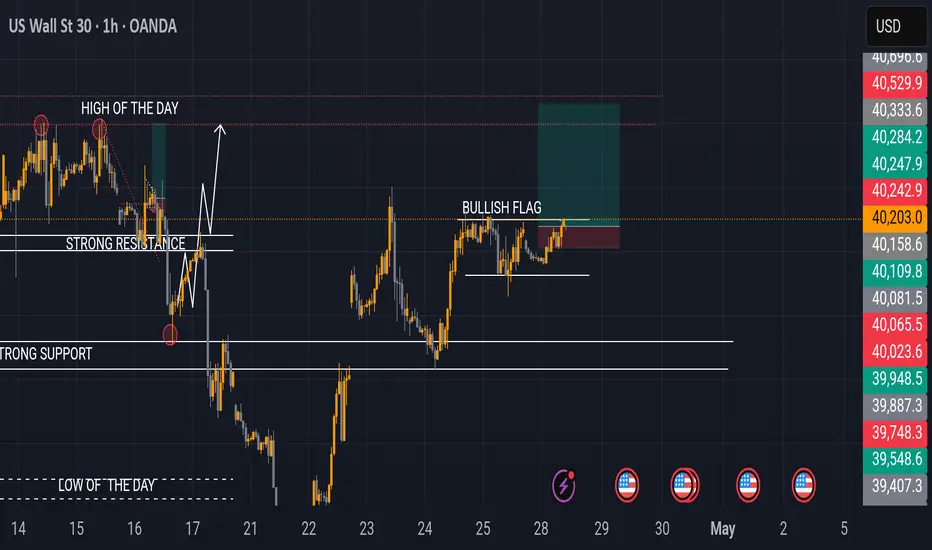
Us300rice pushed above strong support level and now playing within the strong resistance,it formed a bullish continuation patterns so I'm looking for buys
YM (US30): Trend in daily time framePlease pay special attention to the accurate trend, channels, and magic colored levels.
Its very sensitive setup, ...............<<<<<<<<<<<<<<<<<<<<<<<
Be careful
BEST
MT

Hanzo | US30 15 min Breaks – Will Confirm the Next Move🆚 US30 – Hanzo’s Strike Setup
🔥 Timeframe: 15-Minute (15M)
——————
💯 Main Focus: Bullish Breakout at 40360
We are watching this zone closely.
💯 Main Focus: Bearish Breakout at 40130
We are watching this zone closely.
📌 If price breaks with high volume, it confirms Smart Money is in control, and a strong move may follow.
———
Analysis
👌 Market Signs (15M TF):
• Liquidity Grab + CHoCH at 40420
• Liquidity Grab + CHoCH at 39870
• Strong Rejections seen at:
➗ 39900 – Major support / Key level
➗ 40300 : 40400 – Proven resistance
🩸 Key Zones to Watch:
• 40200 – 🔥 Bullish breakout level X 3 Swing Retest
• 40550 – Strong resistance (tested 5 times)
• 40200 – Equal lows
• 40420 – Equal highs
Hanzo | US30 15 min Breaks – Will Confirm the Next Move
BUY US30 nowWe’re seeing a potential breakout and retest setup forming on the US30, with clear market structure and volume confirmation.
🔹 Range Formation
Price recently consolidated in a defined range between ~40,230 and ~40,400. This range was respected multiple times, showing strong participation from both buyers and sellers.
🔹 Volume Profile Insight
The Point of Control (POC) — marked by the red horizontal line — sits just below the current price level. This is the price area where the highest volume was traded, indicating strong interest and potential future support.
🔹 Trade Idea
A bullish breakout was initiated above the range, targeting the 40,683.64 zone:
Entry: Just above the range high
POC (Support zone): Around 40,231
Stop Loss: Below the POC (~40,141)
Take Profit: Next major resistance (~40,683)
🔹 Current Behavior
Price is now retesting the POC — a critical moment. If it holds, we could see another push higher. A clean breakdown below the POC would invalidate the bullish scenario and suggest sellers are gaining control.
🧠 Key Watch Levels:
Hold of POC = potential long continuation
Break below 40,141 = reevaluate bias
🎯 Reminder: Trade the reaction, not the prediction. Let price confirm your thesis before acting.

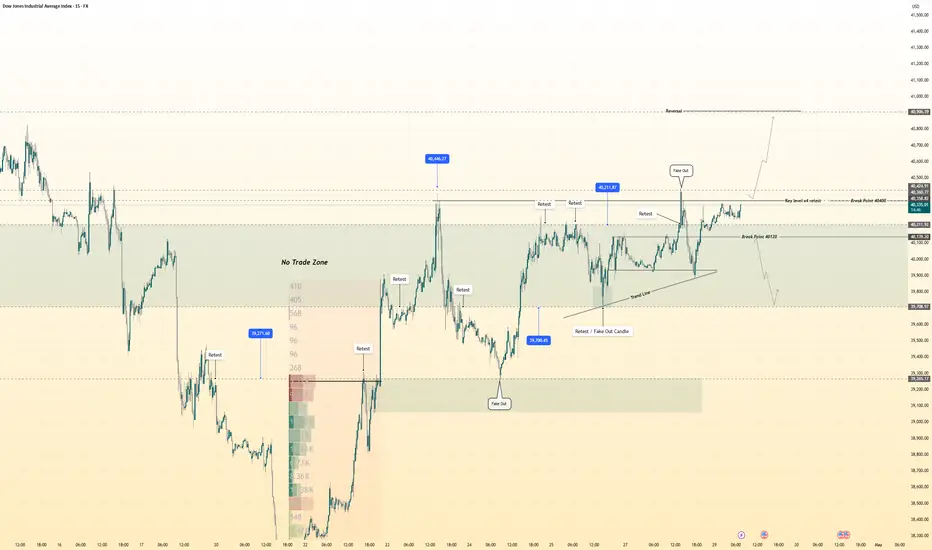
US30 update chart analysis US30 update off Higher Time frames and using FVG,Liquidity Zones, Trend Lines I can see Us30 chasing sellside LQ it can retrace up to Daily Buyside LQ which is 800 pips from current price. the drop is looking like 3k pips close to 4k pips ish. Safe trading.

US30US30 reacted from 38K level as predicted, now correction and further upside towards 41K level.
Disclosure: We are part of Trade Nation's Influencer program and receive a monthly fee for using their TradingView charts in our analysis.

US30 – Rejection from Supply Zone! Dow Heading Lower?Timeframe: 1H | Strategy: Supply & Demand + Price Action
The Dow Jones just tagged a key supply zone near 40,965 and printed a clean rejection candle — a potential signal that bulls are losing control.
Technical Outlook:
Supply Zone (Resistance): 40,965 – 41,020
Breakdown Point: Below 40,486 = possible short trigger
Demand Target Zone: 39,938 – 40,000 (orange block)
Observations:
Price attempted a breakout but was rejected at the top of the supply zone
A clean bearish candle has formed at resistance
Market sentiment may be shifting ahead of upcoming U.S. data (see icon)
Trade Idea (Bearish Bias):
Entry: Below 40,486
Target: 39,938
Stop Loss: Above 41,020
Watch for volume confirmation and retest of the breakdown level.
Invalidation:
If price closes above 41,020 on strong momentum, the bearish setup is off the table.
Fundamental Alert:
US data/events may trigger volatility soon — watch for fakeouts or sharp reversals.
Will the Dow retrace to the 40K zone, or is this a false sell signal? Drop your view below!
Like & follow for more clean price action setups!
#US30 #DowJones #PriceAction #SupplyAndDemand #LuxAlgo #TradingStrategy #TechnicalAnalysis #Indices #BearishReversal #TradingView

US30 - 30 mins candle demand zone potential Potential Demand zone entry IF price hits that level.... Thoughts?


Update on US302:1 RR hit ✅ Day is completed. I will now leave the market alone and go enjoy the rest of my day. I pray you too will have a blessed end of day and weekend Reflect on the week, Rest and Enjoy your time with your loved ones

DowJones INTRADAY at pivotal zone Key Support and Resistance Levels
Resistance Level 1: 41200
Resistance Level 2: 42000
Resistance Level 3: 42710
Support Level 1: 39446
Support Level 2: 38490
Support Level 3: 37840
This communication is for informational purposes only and should not be viewed as any form of recommendation as to a particular course of action or as investment advice. It is not intended as an offer or solicitation for the purchase or sale of any financial instrument or as an official confirmation of any transaction. Opinions, estimates and assumptions expressed herein are made as of the date of this communication and are subject to change without notice. This communication has been prepared based upon information, including market prices, data and other information, believed to be reliable; however, Trade Nation does not warrant its completeness or accuracy. All market prices and market data contained in or attached to this communication are indicative and subject to change without notice.

US30 Trading Into Major Resistance - Look For Dow Jones Retrace🔍 US30 Analysis: At the moment, I'm watching the US30 as it looks overextended 📈 and is trading into previous highs. 🧱 If you look left on the chart, it's approaching a key resistance level on both the weekly and daily timeframes.
I’m expecting a potential retracement 🔁 and monitoring for a bearish break of structure on the 30-minute timeframe ⏱️ as a possible setup for a counter-trend short 📉 — aiming for the imbalance zone visible on that timeframe.
📏 Drawing a Fibonacci retracement from the recent swing low to high, the 50% equilibrium 🔄 lines up perfectly with the imbalance area, adding confluence to the idea.
📚 This is shared for educational purposes only and should not be considered financial advice 💼.

DJIA H4 | Pullback resistance at 78.6% Fibonacci retracementThe DJIA (US30) is rising towards a pullback resistance and could potentially reverse off this level to drop lower.
Sell entry is at 41,305.11 which is a pullback resistance that aligns close to the 78.6% Fibonacci retracement.
Stop loss is at 42,743.85 which is a swing-high resistance.
Take profit is at 39,324.35 which is an overlap support.
High Risk Investment Warning
Trading Forex/CFDs on margin carries a high level of risk and may not be suitable for all investors. Leverage can work against you.
Stratos Markets Limited (tradu.com):
CFDs are complex instruments and come with a high risk of losing money rapidly due to leverage. 63% of retail investor accounts lose money when trading CFDs with this provider. You should consider whether you understand how CFDs work and whether you can afford to take the high risk of losing your money.
Stratos Europe Ltd (tradu.com):
CFDs are complex instruments and come with a high risk of losing money rapidly due to leverage. 63% of retail investor accounts lose money when trading CFDs with this provider. You should consider whether you understand how CFDs work and whether you can afford to take the high risk of losing your money.
Stratos Global LLC (tradu.com):
Losses can exceed deposits.
Please be advised that the information presented on TradingView is provided to Tradu (‘Company’, ‘we’) by a third-party provider (‘TFA Global Pte Ltd’). Please be reminded that you are solely responsible for the trading decisions on your account. There is a very high degree of risk involved in trading. Any information and/or content is intended entirely for research, educational and informational purposes only and does not constitute investment or consultation advice or investment strategy. The information is not tailored to the investment needs of any specific person and therefore does not involve a consideration of any of the investment objectives, financial situation or needs of any viewer that may receive it. Kindly also note that past performance is not a reliable indicator of future results. Actual results may differ materially from those anticipated in forward-looking or past performance statements. We assume no liability as to the accuracy or completeness of any of the information and/or content provided herein and the Company cannot be held responsible for any omission, mistake nor for any loss or damage including without limitation to any loss of profit which may arise from reliance on any information supplied by TFA Global Pte Ltd.
The speaker(s) is neither an employee, agent nor representative of Tradu and is therefore acting independently. The opinions given are their own, constitute general market commentary, and do not constitute the opinion or advice of Tradu or any form of personal or investment advice. Tradu neither endorses nor guarantees offerings of third-party speakers, nor is Tradu responsible for the content, veracity or opinions of third-party speakers, presenters or participants.

US30, bearish analysisBearish count for US30.
Impulse wave from ATH, wave ((2)) is expanded flat, wave ((4)) appears to be a double-three, with (W) a regular flat, (X) and (Y) are zigzags.
I like wave (((4)) to finish below resistance at 42008, with wave ((5)) to approach October 2022 low of 28586.8.


Possibility of uptrend Given the behavior of the index within the current resistance range, possible scenarios have been identified. It is expected that after some volatility, a corrective trend will form.

Trade Idea: US30 Long (BUY LIMIT)Technical Analysis Summary
Daily Chart (Macro View)
• Price has bounced off a key support near 37,700 and reclaimed the psychological level 40,000.
• MACD is starting to reverse higher from oversold conditions, showing early bullish divergence.
• RSI is recovering from below 30, now near 49, indicating a potential trend reversal.
• Trend: Medium-term recovery from a correction; possible continuation to recent highs around 44,000.
15-Minute Chart (Tactical Entry Zone)
• Price has broken a downtrend and is now consolidating above previous resistance at 40,000.
• MACD is bullish (histogram rising), and signal lines are above zero.
• RSI at 62.6, suggesting bullish momentum but not yet overbought.
• White MA shows clear upward curvature.
3-Minute Chart (Precision Entry)
• Recent pullback retested the MA and bounced.
• RSI at 66, nearing overbought, but price is in clear short-term uptrend.
• MACD just crossed bullish again after a small consolidation.
⸻
Fundamental Context
• Recent Fed signals suggest potential rate pause or cuts, which is bullish for indices.
• Earnings season has generally surprised to the upside, especially among large caps.
• Macro backdrop: Slowing inflation + strong labor market = supportive of equities.
• Risk appetite is increasing, as seen in tech and industrials rebounding.
⸻
Trade Setup
• Position: Long US30
Entry
• Buy: 40,200 (current price action confirms upward momentum)
Stop Loss (SL)
• SL: 39,700 (below recent 15-min swing low & psychological level)
Take Profit (TP)
• TP1: 41,200 (recent intraday high and near resistance)
FUSIONMARKETS:US30

Trade Idea: Long (MARKET)Technical Confluence:
Daily Chart:
• Strong bullish engulfing recovery from recent support (~37,700).
• MACD starting to curl back up from deeply negative levels — possible trend reversal.
• RSI recovering above 50 (currently 52.49), suggesting bullish strength resuming.
15-Min Chart:
• Sustained uptrend with pullbacks respecting the moving average.
• MACD crossing positive territory.
• RSI at 64.77 with room to move higher before hitting overbought levels.
3-Min Chart:
• Tight consolidation after a sharp breakout to 40,766 — forming a potential bull flag.
• RSI at 58.89 — mid-level with upward momentum potential.
• MACD histogram shrinking — possible continuation breakout imminent.
⸻
Fundamental Context:
• Market Sentiment: U.S. markets are generally supported due to strong earnings reports and decreasing recession fears. Treasury yields have stabilized, and risk appetite is returning.
• Upcoming Events: FOMC rate decision is key — bullish bias if they hold or soften tone.
⸻
Trade Details:
• Entry: 40,770
• Price is consolidating just under this resistance. Enter on breakout with volume confirmation.
• Stop Loss (SL): 40,350
• Below recent support on the 15M chart and under the moving average. Conservative SL with volatility in mind.
• Take Profit (TP): 41,450
• Measured move from the flag pattern and aligns with Fibonacci extension and historical resistance.
FUSIONMARKETS:US30

US30 (Dow Jones) – Short Setup in Play – May 2, 2025🔍 Setup Summary:
Price is trading within a bearish internal channel and has shown a reaction from a lower high inside the upper boundary. There’s clear intent to grab liquidity, possibly sweep the short-term high above the descending wedge, then reject sharply.
📉 Trade Idea:
Looking for price to spike up toward the upper channel resistance (~41,250–41,300), potentially sweep liquidity, then reject and break below the ascending trendline. A clean short could target the 15-min FVG zone and demand block around 40,600, with extended targets toward 40,300.
✅ Confluences:
Bearish market structure and channel
Potential liquidity sweep + internal market trap
Fair Value Gap + previous demand zones below
Trendline break setup for entry confirmation
📌 Bias: Bearish – short-term rally expected before a move lower
🕒 Timeframe: 15-minute chart
📈 Risk-to-Reward: 2.5–3:1 depending on entry point and target zone
⚠️ Disclaimer:
This is my personal outlook based on technical analysis. It is not financial advice. Always conduct your own research, manage risk appropriately, and use proper trade management. Markets carry risk — trade safe.

US30 - LONGWaiting for the retest all day and finally got it in after hours trading. Looking for price to continue to the upside now that we got the retest.

US30 - AnalysisKey Levels to look for:
Resistance - 41250
Support - 40800
Currently price show a neutral trend. Resistance level must be broken for a bullish outlook as long as support is respected. A double top formation near resistance level. Failure to break this level will result in retest of support level.

DowJones INTRADAY NFP volatility trigger! Momentum is bullish, but today’s NFP report is a key risk event. A weaker-than-expected jobs number could reinforce rate cut bets and extend the rally. A surprise beat may trigger profit-taking.
Key Support and Resistance Levels
Resistance Level 1: 41200
Resistance Level 2: 42000
Resistance Level 3: 42710
Support Level 1: 39446
Support Level 2: 38490
Support Level 3: 37840
This communication is for informational purposes only and should not be viewed as any form of recommendation as to a particular course of action or as investment advice. It is not intended as an offer or solicitation for the purchase or sale of any financial instrument or as an official confirmation of any transaction. Opinions, estimates and assumptions expressed herein are made as of the date of this communication and are subject to change without notice. This communication has been prepared based upon information, including market prices, data and other information, believed to be reliable; however, Trade Nation does not warrant its completeness or accuracy. All market prices and market data contained in or attached to this communication are indicative and subject to change without notice.
