"US30/DJI" Index Market Bullish Robbery (Swing Trade Plan)🌟Hi! Hola! Ola! Bonjour! Hallo! Marhaba!🌟
Dear Money Makers & Robbers, 🤑 💰💸✈️
Based on 🔥Thief Trading style technical and fundamental analysis🔥, here is our master plan to heist the "US30/DJI" Index Market Heist. Please adhere to the strategy I've outlined in the chart, which emphasizes long entry. Our aim is to escape near the high-risk YELLOW MA Zone. It's a Risky level, overbought market, consolidation, trend reversal, trap at the level where traders and bearish robbers are stronger. 🏆💸"Take profit and treat yourself, traders. You deserve it!💪🏆🎉
Entry 📈 : "The vault is wide open! Swipe the Bullish loot at any price - the heist is on!
however I advise to Place buy limit orders within a 15 or 30 minute timeframe most recent or swing, low or high level. I Highly recommended you to put alert in your chart.
Stop Loss 🛑:
Thief SL placed at the Nearest / Swing low level Using the 3H timeframe (39200) Day/Swing trade basis.
SL is based on your risk of the trade, lot size and how many multiple orders you have to take.
🏴☠️Target 🎯: 42400
💰💵💸"US30/DJI" Index Money Heist Plan is currently experiencing a bullishness,., driven by several key factors. .☝☝☝
📰🗞️Get & Read the Fundamental, Macro Economics, COT Report, Geopolitical and News Analysis, Sentimental Outlook, Intermarket Analysis, Index-Specific Analysis, Future trend targets with Overall outlook score... go ahead to check 👉👉👉🔗🔗🌎🌏🗺
⚠️Trading Alert : News Releases and Position Management 📰🗞️🚫🚏
As a reminder, news releases can have a significant impact on market prices and volatility. To minimize potential losses and protect your running positions,
we recommend the following:
Avoid taking new trades during news releases
Use trailing stop-loss orders to protect your running positions and lock in profits
💖Supporting our robbery plan 💥Hit the Boost Button💥 will enable us to effortlessly make and steal money 💰💵. Boost the strength of our robbery team. Every day in this market make money with ease by using the Thief Trading Style.🏆💪🤝❤️🎉🚀
I'll see you soon with another heist plan, so stay tuned 🤑🐱👤🤗🤩
US30 trade ideas


US30 shortWhat is a bear market?
A downward market with strong rallies. we are around a turn around area. Positive job data is just hysteria, false confidence.
>Momentum to the upside fading
>lower high on 5 mins
>countertrend!

YFI/USDTIn this analysis, I’m tracking the recent downtrend on the US30 daily chart. Based on the current pattern and technical indicators (like RSI divergence and a bounce off a key support zone), I expect a potential reversal or at least a short-term correction. Entry signal is marked based on my Smart Bot strategy.

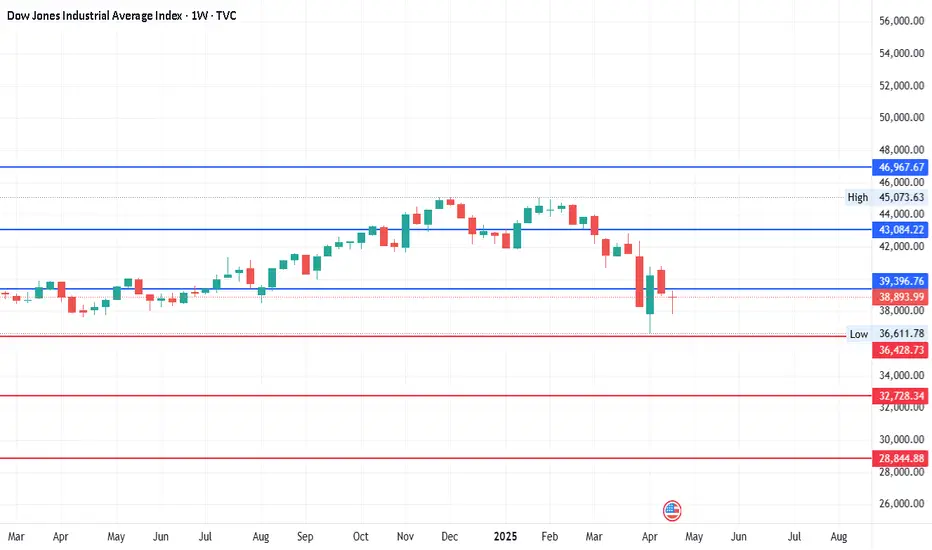
Market Digesting Trade War Fears — But Risks RemainSimilar to the early stage of Trump's previous administration, escalating trade tensions and tariff threats have once again rattled market sentiment, triggering a broad-based correction in equity indices down to key support levels.
Over the past two weeks, extreme trade war rhetoric shocked the market, causing the index to break below the 40,000-point support, reaching a low of 36,439 — near the 200-day moving average on the weekly chart. As this level coincides with a significant technical support zone, buying interest emerged, prompting a rebound back above the 40,000 mark.
This suggests that the market has begun to digest the trade war narrative, with investors gradually positioning in tranches around the 40,000 level. However, ongoing uncertainty surrounding trade policies may continue to weigh on sentiment. Should the index revisit 36,439 and fail to hold, further downside toward the next major support at 34,969 could be expected.

possibity of uptrendIt is expected that a corrective and fluctuating trend will form in the current resistance range. Then the upward trend will likely continue.

US340 H9 IdeaPotential for a bullish pullback on the US30 1D which could lead to a price movement towards the resistance level at 42200. BUY levels from 39600

correctionGiven the behavior of the index in the current resistance range, it is expected that the upward trend will continue.Otherwise, the correction trend will continue to the specified support levels.

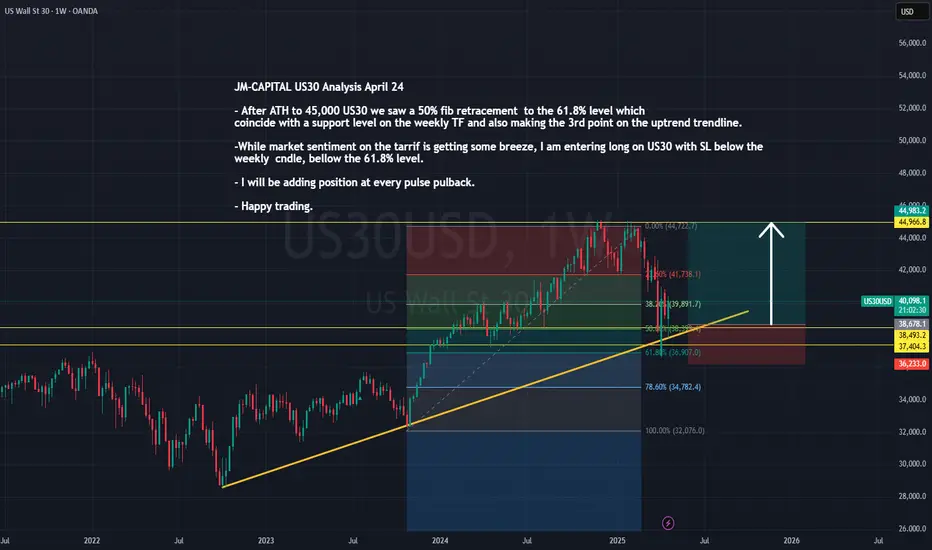
JM-CAPITAL US30 Analysis April 24After reaching an all-time high of 45,000, US30 experienced a pullback, retracing to the 61.8% Fibonacci level—aligning perfectly with a key support zone on the weekly timeframe and forming the third touchpoint on the ascending trendline.
With market sentiment beginning to ease around the tariff discussions, I’m taking a long position on US30. My stop loss is set just below the weekly candle and beneath the 61.8% Fibonacci level for added protection.
I plan to scale into the trade by adding positions on each corrective pullback in line with the bullish structure.
Wishing you all a profitable trading session. Stay sharp!
US30 | 1H | BUYHey There;
SIGNAL ALERT
BUY US30 / 38,689,19
🟢TP1: 39,258,56
🟢TP2: 39,910,75
🟢TP3: 41,287,59
🔴SL: 37,415,50
RR / 2,00
Please don't forget to like 🙏🏻
Thanks to everyone who supports my analysis with likes. 💙💙💙

Us30 Upward or downward?In the 5-minute timeframe, you can sell at the top of the trading range and buy at the bottom of the trading range (by observing reversal candles and patterns).
Alternatively, you can wait for a breakout and enter in the direction of the breakout.
Be mindful of fake breakouts

Dow Jones - Volatility is HighLevels mentioned here are based on the market volatility and it is purely for the study purpose only.
DOW JONES New long-term bottom being formed on the 1W MA200.Dow Jones (DJI) hasn't yet broken above its 1D MA50 (blue trend-line) following the April 07 Low, but is nonetheless consolidating and holding the 1W MA200 (red trend-line), which hasn't broken as Support since October 17 2022.
That was a few days after the bottom of the 2022 Inflation Crisis was formed and the current Channel Up started. In fact, the rallies that started on both Channel Up bottoms since, have been almost identical in range (+22.60% and +23.80% respectively) so technically we should be expecting at least 44800 (+22.60% from April's Low) on the medium-term.
-------------------------------------------------------------------------------
** Please LIKE 👍, FOLLOW ✅, SHARE 🙌 and COMMENT ✍ if you enjoy this idea! Also share your ideas and charts in the comments section below! This is best way to keep it relevant, support us, keep the content here free and allow the idea to reach as many people as possible. **
-------------------------------------------------------------------------------
Disclosure: I am part of Trade Nation's Influencer program and receive a monthly fee for using their TradingView charts in my analysis.
💸💸💸💸💸💸
👇 👇 👇 👇 👇 👇

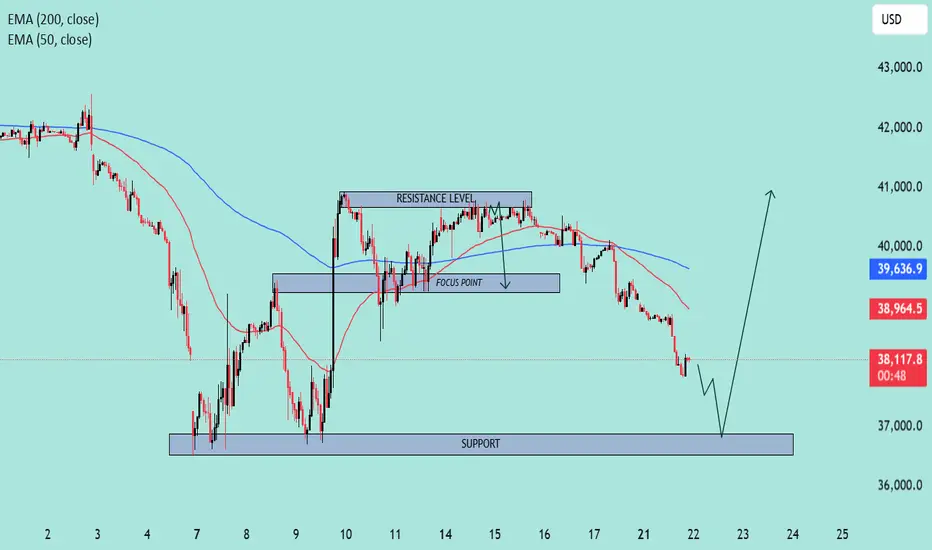
US30 Approaching Key Support Zone – Potential Reversal Ahead?📊 Chart Overview:
Timeframe: Looks like an intraday (maybe 1H or 2H).
Indicators:
EMA 50 (Red): 38,964.7
EMA 200 (Blue): 39,637.0
🔍 Key Levels & Structure:
🔵 Support Zone (Highlighted):
Around 36,800 – 37,200 range.
This is a well-tested support level where price previously bounced.
Current price action is approaching this zone again, which increases the chance of a potential bullish reaction.
🟣 Resistance Level:
Defined around 40,500 area.
Price has rejected multiple times from this zone.
Previously served as a consolidation/decision area.
📍 Focus Point (Previous Support Turned Resistance):
Near 38,700 – 39,000.
This level may act as a reaction point on the way back up.
📉 Current Price Action:
Strong downward momentum heading into the support zone.
Price is under both EMAs, suggesting short-term bearish trend.
However, the drawn arrow suggests a potential reversal bounce from the support.
🧠 Interpretation & Scenario Plan:
🅰️ Bullish Scenario:
Price touches or sweeps the support zone.
Bullish structure or reversal candle forms (e.g., hammer, bullish engulfing).
Break back above EMA 50 & Focus Point could confirm the shift.
Target: Revisit Resistance Zone (above 40,000).
🅱️ Bearish Scenario:
Support fails to hold.
Clean break below 36,800 with volume could lead to accelerated sell-off.
Watch for breakdown retests of support turned resistance.
🔔 Takeaway:
⚠️ Current move is bearish, but price is approaching a key demand zone. Bulls might step in if the zone holds. Confirmation is key before going long. Reclaiming EMAs would strengthen bullish bias.
US30 - SHORTPrice continued to push to the downside last week after a brief push to the upside. I expect price to continue selling momentum throughout this week after a price action confirmation at this current level on the 4 hour or 1 hour time frame.
TP set at 36975.

DOW JONES INDEX (US30): Another Gap to Watch
US30 is on its way to fill the gap up that was formed 2 days ago.
It looks like the market will reach a gap opening level soon.
I expect a bearish movement at least to 39285
❤️Please, support my work with like, thank you!❤️
I am part of Trade Nation's Influencer program and receive a monthly fee for using their TradingView charts in my analysis.

Could the price bounce from here?Dow Jones (US30) is falling towards the pivot which is an overlaps upport and could bounce to the 1st resistance which acts as a pullback resistance.
Pivot: 39,318.40
1st Support: 37,848.26
1st Resistance: 40,824.20
Risk Warning:
Trading Forex and CFDs carries a high level of risk to your capital and you should only trade with money you can afford to lose. Trading Forex and CFDs may not be suitable for all investors, so please ensure that you fully understand the risks involved and seek independent advice if necessary.
Disclaimer:
The above opinions given constitute general market commentary, and do not constitute the opinion or advice of IC Markets or any form of personal or investment advice.
Any opinions, news, research, analyses, prices, other information, or links to third-party sites contained on this website are provided on an "as-is" basis, are intended only to be informative, is not an advice nor a recommendation, nor research, or a record of our trading prices, or an offer of, or solicitation for a transaction in any financial instrument and thus should not be treated as such. The information provided does not involve any specific investment objectives, financial situation and needs of any specific person who may receive it. Please be aware, that past performance is not a reliable indicator of future performance and/or results. Past Performance or Forward-looking scenarios based upon the reasonable beliefs of the third-party provider are not a guarantee of future performance. Actual results may differ materially from those anticipated in forward-looking or past performance statements. IC Markets makes no representation or warranty and assumes no liability as to the accuracy or completeness of the information provided, nor any loss arising from any investment based on a recommendation, forecast or any information supplied by any third-party.

Dow Jones Potential DownsidesHey Traders, in the coming week we are monitoring US30 for a selling opportunity around 39700 zone, Dow Jones is trading in a downtrend and currently is in a correction phase in which it is approaching the trend at 39700 support and resistance area.
Trade safe, Joe.

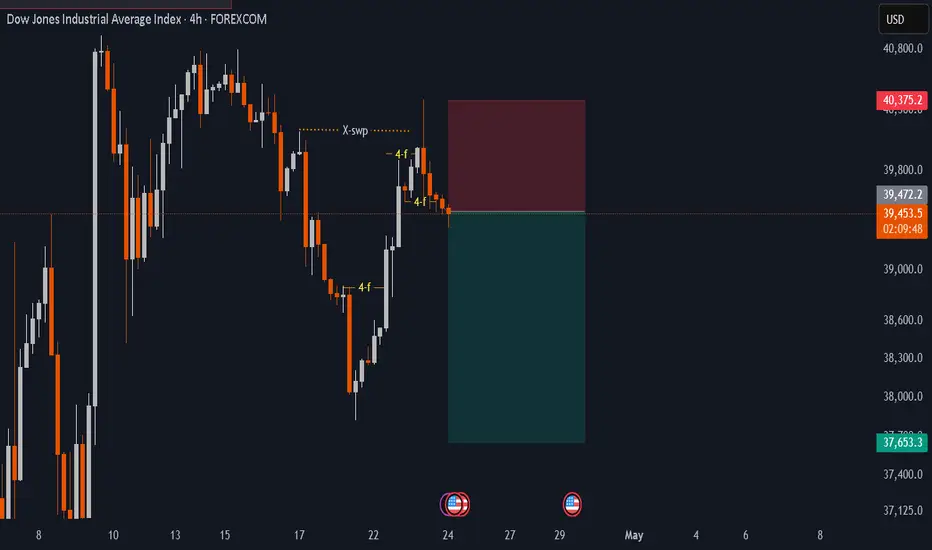
US30idea about the trade is very clear.
1d swing is bearish.
1d fractals is bearish.
4h price movementum gone up takan-out liquidity ,now gave 4h fractals shift towards downside . I m in a sell.
DJI Long....A simple Supply Demand Logic trade. The price is well over Supply zone and is still holding the potential to move further up ahead.....
TP 40520
SL 39899


Dow Jones INTRADAY capped at 40954Key Support and Resistance Levels
Resistance Level 1: 40954
Resistance Level 2: 41510
Resistance Level 3: 42216
Support Level 1: 39600
Support Level 2: 38534
Support Level 3: 37832
This communication is for informational purposes only and should not be viewed as any form of recommendation as to a particular course of action or as investment advice. It is not intended as an offer or solicitation for the purchase or sale of any financial instrument or as an official confirmation of any transaction. Opinions, estimates and assumptions expressed herein are made as of the date of this communication and are subject to change without notice. This communication has been prepared based upon information, including market prices, data and other information, believed to be reliable; however, Trade Nation does not warrant its completeness or accuracy. All market prices and market data contained in or attached to this communication are indicative and subject to change without notice.
