DOW JONES Last chance to buy before it breaks the 1D MA50.Dow Jones (DJIA) has been trading within a 1.5 year Channel Up pattern since the July 2023 High. The market found itself under heavy pressure recently as the Channel unfolded its Bearish Leg which found Support right below the 1D MA200 (orange trend-line).
As the 1D RSI got oversold (<30.00) and rebounded, this is perhaps the last opportunity to buy low, before it breaks above its 1D MA50 (blue trend-line) on what is technically the new Bullish Leg.
The previous Bullish Leg (November 2023 - March 2024) hit the 2.0 Fibonacci extension on a +23.94% rise, before it broke below its 1D MA50 again. As a result, it is possible for Dow not to break again below its 1D MA50 once broken, before it reaches the 2.0 Fib which sits at 50000. Our Target is a little lower than that at 49000.
-------------------------------------------------------------------------------
** Please LIKE 👍, FOLLOW ✅, SHARE 🙌 and COMMENT ✍ if you enjoy this idea! Also share your ideas and charts in the comments section below! This is best way to keep it relevant, support us, keep the content here free and allow the idea to reach as many people as possible. **
-------------------------------------------------------------------------------
Disclosure: I am part of Trade Nation's Influencer program and receive a monthly fee for using their TradingView charts in my analysis.
💸💸💸💸💸💸
👇 👇 👇 👇 👇 👇
US30 trade ideas

US30 SELL NOW!!!!!!!!US30 created a gap on the 30min time frame and made a rising wedge with a breakout and retest off the supply zone am looking forward to short us30 to the POC level
JOIN AND ENJOY........

Wall Street sellWe hit the Wall Street sell signal with our friends in the sales channel and so far we have achieved the target of one to nine.
@SEED_G88

DOW-US30 time to go long on DOWTeam, i wish i could show you my real account
time to go long on DOW - double bottom - retested
looking at 120-200 points recover

US30 Sells Idea for the New York SessionUnless we see some news come out on tariffs, we could see some downside on US30 today. It is falling inside a wedge pattern right now, and I expect the price action to fall within that wedge with a potential to go down during the New York session. I will be waiting for a break of the upper green zone (around 42150), then a pullback and rejection, to take sells down towards the 42000 (and possibly lower) areas.
I am not looking for any buys on US30 today, unless I see some really big green candles towards the upside during the 9:30 am EST.

US30 Short Trump Tariffs/ Inflation and FEDBad Data! Recession,inflation! That says it all.
Enties exits:See the chart please!

Hanzo | US30 15 min Breaks – Confirm the Next Move(🆚) US30 – The Way of the Silent Blade
🔥 Bearish Break Out Path – 42440
🩸Liquidity Sweep – Stop-clearing before reversal.
🩸CHoCH – Bearish trend confirmation.
🩸Key Level Retest – Historical reaction zone.
🩸Weekly/Monthly Zone – High-probability sell area.
👌 Entry: Break 42440 + momentum → Retest → Short position → Target lower liquidity.
☄️ Trading Insights:
💯 Liquidity moves the market.
✈️ Volume confirms breakouts.
👍 Precision wins—no hesitation.

2 Idea for us30These two scenarios are likely in the coming days, and my outlook on the Dow Jones is bullish. I believe these are the last days the Dow Jones will be trading at these price levels.

Falling towards pullback support?Dow Jones (US30) is falling towards the pivot which has been identified as a pullback support and could bounce to the overlap resistance.
Pivot: 42,056.64
1st Support: 41,442.18
1st Resistance: 42,990.
Risk Warning:
Trading Forex and CFDs carries a high level of risk to your capital and you should only trade with money you can afford to lose. Trading Forex and CFDs may not be suitable for all investors, so please ensure that you fully understand the risks involved and seek independent advice if necessary.
Disclaimer:
The above opinions given constitute general market commentary, and do not constitute the opinion or advice of IC Markets or any form of personal or investment advice.
Any opinions, news, research, analyses, prices, other information, or links to third-party sites contained on this website are provided on an "as-is" basis, are intended only to be informative, is not an advice nor a recommendation, nor research, or a record of our trading prices, or an offer of, or solicitation for a transaction in any financial instrument and thus should not be treated as such. The information provided does not involve any specific investment objectives, financial situation and needs of any specific person who may receive it. Please be aware, that past performance is not a reliable indicator of future performance and/or results. Past Performance or Forward-looking scenarios based upon the reasonable beliefs of the third-party provider are not a guarantee of future performance. Actual results may differ materially from those anticipated in forward-looking or past performance statements. IC Markets makes no representation or warranty and assumes no liability as to the accuracy or completeness of the information provided, nor any loss arising from any investment based on a recommendation, forecast or any information supplied by any third-party.

DOW JONES - FAKE BREAKDOWNHello Traders !
The US30 failed to break the support level (41603 - 41958).
The price formed a bullish candlestick pattern.
So, I expect a bullish move🚀
_______________
TARGET: 42965🎯

Hanzo | US30 15 min Breaks – Confirm the Next Move🆚 US30 – The Way of the Silent Blade
⭐️ We do not predict—we calculate.
We do not react—we execute.
Patience is our shield. Precision is our sword.
🩸 market is a battlefield where hesitation means death. The untrained fall into traps, chasing shadows, believing in illusions. But we are not the crowd. We follow no signal but the one left behind by Smart Money. Their footprints are our way forward.
🩸 Bearish Structure Shatters
Key Break Confirms the Path – 42480 Zone
our reversal always at key level
even a reversal area is well studded
reasons
Liquidity Swwep
liquidity / choch
key level / multi retest before
weekly / monthly zone
🔻 This is the threshold where the tides shift. If price pierces this level with authority, it is no accident—it is designed. The liquidity pool above has been set, and the institutions will claim their prize. Volume must confirm the strike. A clean break, a strong push, and the path is set.
Watch the volume. Watch the momentum. Strike without doubt

US30 index In the AM session we have seen big bearish move and now Expecting some retracement on us30 after lunch hour to HH or LH

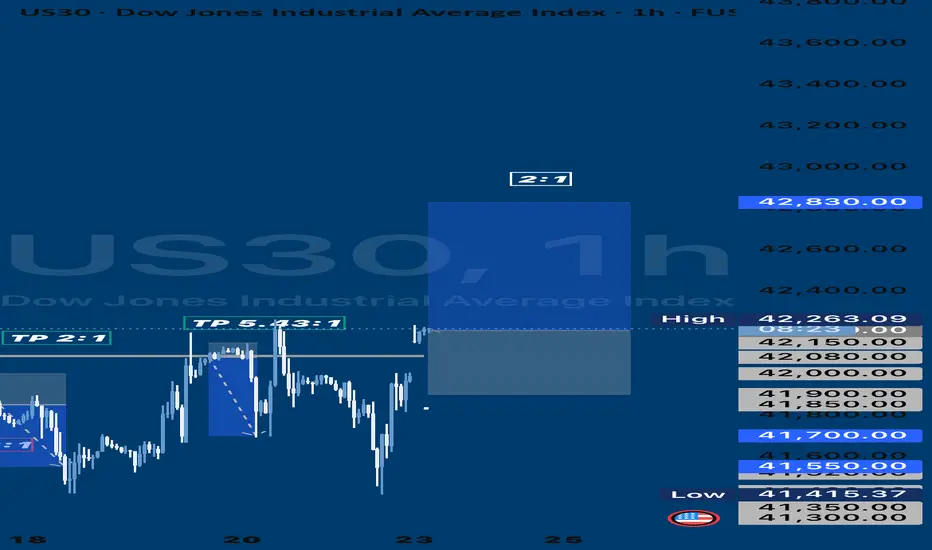
Trade Idea: US30 Long ( BUY LIMIT )1. Technical Analysis Breakdown:
Daily Chart:
• Trend: Bullish overall, but showing signs of pullback.
• MACD: Bearish, indicating weakening momentum.
• RSI: At 45.23 — neutral but leaning toward oversold territory.
• Support level: Around 41,500.
• Resistance level: Recent high near 42,890.
15-Min Chart:
• Trend: Strong intraday upward momentum.
• MACD: Bullish crossover with momentum building.
• RSI: 69.09 — nearing overbought but still has room.
• Support: Around 41,760.
• Resistance: 42,208 (current price), next major level at 42,500.
3-Min Chart:
• Trend: Short-term bullish with a slight consolidation.
• MACD: Flat, showing a pause but no reversal yet.
• RSI: 53.19 — mid-range, suggesting more upside potential.
⸻
2. Fundamental Analysis:
• US economy shows resilience (strong job data, improved GDP).
• Fed’s stance on rates remains balanced, leaning dovish, supporting equities.
• Geopolitical tensions slightly cooling, risk appetite growing.
⸻
3. Trade Plan — Long Position (Buy)
• Entry: 42,210 (after a clean break above consolidation).
• Stop Loss (SL): 41,900 (below recent intraday support).
• Take Profit (TP): 42,830 (previous daily high). FUSIONMARKETS:US30
Hanzo | US30 15 min Breaks – Confirm the Next Move(🆚) US30 – The Way of the Silent Blade
🔥 Bullish Break Out Path – 42680
🩸Liquidity Sweep – Institutions grab liquidity before pushing higher.
🩸CHoCH – Trend shift confirmation.
🩸Key Level Retest – Strong breakout zone.
🩸Weekly/Monthly Zone – Institutional accumulation.
👌 Entry: Break 42680 + volume → Retest → Long position → Secure profits.
🔥 Bearish Break Out Path – 42480
🩸Liquidity Sweep – Stop-clearing before reversal.
🩸CHoCH – Bearish trend confirmation.
🩸Key Level Retest – Historical reaction zone.
🩸Weekly/Monthly Zone – High-probability sell area.
👌 Entry: Break 42480 + momentum → Retest → Short position → Target lower liquidity.
☄️ Trading Insights:
💯 Liquidity moves the market.
✈️ Volume confirms breakouts.
👍 Precision wins—no hesitation.

djiDow Jones - DJI
- Completed " 1234 " Impulsive Waves
- Break of Structure
- RSI - Divergence
- Order Block
- Resistance Level

Us30 sell market technicals Us30 sell market technicals. Looking like a nice drop from trend lines. Signal was sent to GTE vip.

US 30 daily time frame US30 (Dow Jones) Daily Chart Analysis – Bearish Breakdown Ahead?
Market Structure & Trend Analysis:
The chart shows a Head and Shoulders (H&S) pattern, which is a bearish reversal formation.
Neckline break confirmed, suggesting further downside movement.
The large blue arrow points to the next key support area near 38,731, representing a potential drop of about -9.51%.
Key Levels to Watch:
Resistance: 42,500 - 43,000 (previous support turned resistance).
Support: 38,731 (historical demand zone & target from the H&S breakdown).
RSI & Volume Analysis:
RSI at 36.82, nearing oversold territory but still has room for further downside.
Volume increased on the breakdown, confirming selling pressure.
Trade Considerations:
📉 Bearish Scenario: If price stays below the broken trendline, we could see a continuation towards 38,731.
📈 Bullish Scenario: If price reclaims 43,000, the bearish pattern could be invalidated.
⚠️ Wait for Retest: A potential retest of the neckline (around 42,500) before further decline.

US30 Update - Potential TargetsI calibrated the analysis a little:
It seems like stocks have some bullish strength.
We'll have to wait and see if the imbalance will be filled in
the short term.
Feel free to ask if anything is unclear.
Thank you for taking the time to study my analysis

US30 H1 IdeaPotential for a bullish pullback on the US30 H1 which could lead to a price movement towards the resistance level at 42500. BUY levels from 41800

Dow Jones on the weekly chartAs you can see, due to recent economic news and Trump's economic approaches, we have unfortunately witnessed a decline in major indices, including the Dow Jones. We are currently at the last available support level, which is the bottom of the Dow Jones long-term channel, and we need to see how it reacts to this level in tomorrow's news and the CPI release.

Dow Jones Industrial Average ($US30): Market Mover or Stumbling?(1/9)
Good afternoon, everyone! ☀️ Dow Jones Industrial Average ( BLACKBULL:US30 ): Market Mover or Stumbling Block?
With the Dow at $42,407.80, is this blue-chip index a steady climber or a shaky step? Let’s chart the course! 🔍
(2/9) – PRICE PERFORMANCE 📊
• Current Price: $ 42,407.80 as of Mar 24, 2025 💰
• Recent Move: Up 0.8% from $41,985.35 on Mar 21, per data 📏
• Sector Trend: Mixed with tech, aerospace gains 🌟
It’s a bumpy climb—let’s see what’s driving it! ⚙️
(3/9) – MARKET POSITION 📈
• Composition: 30 U.S. blue-chip firms, all sectors but transport, utilities 🏆
• Trend: Volatile but up 1.2% weekly as of Mar 21, per data ⏰
• Sentiment: Cautious optimism amid trade tensions 🎯
Firm but tested by macro winds! 📊
(4/9) – KEY DEVELOPMENTS 🔑
• Fed Update: Rates steady, economic uncertainty up, per data 🌍
• Sector Gains: Boeing up 7% on Air Force deal, per data 📋
• Market Reaction: Dow up after tariff reprieve hopes 💡
Navigating a stormy market! 🌪️
(5/9) – RISKS IN FOCUS ⚡
• Trade Tensions: U.S.-China tariffs spark inflation fears 🔍
• Economic Slowdown: Consumer sentiment at 2022 lows 📉
• Policy Shifts: Trump tariffs add uncertainty ❄️
It’s a rocky path—watch the curves! 🛑
(6/9) – SWOT: STRENGTHS 💪
• Blue-Chip Base: 30 industry leaders 🥇
• Sector Gains: Tech, aerospace lift index 📊
• Resilience: Up 12.7% from 52-week low 🔧
Got a sturdy engine under the hood! 🏦
(7/9) – SWOT: WEAKNESSES & OPPORTUNITIES ⚖️
• Weaknesses: Volatility, 5.9% off peak 📉
• Opportunities: Rate cut hopes, tech rebound 📈
Can it climb higher or stall out? 🤔
(8/9) – POLL TIME! 📢
Dow at $42,407.80—your take? 🗳️
• Bullish: $44,000+ soon, rally resumes 🐂
• Neutral: Steady, risks balance out ⚖️
• Bearish: $40,000 looms, correction deepens 🐻
Chime in below! 👇
(9/9) – FINAL TAKEAWAY 🎯
Dow’s $42,407.80 price shows cautious gains 📈, but volatility’s in the air 🌿. Dips are our DCA fuel 💰—buy low, ride high! Gem or bust?

Dow Jones: Double-Top Signals Heightened VulnerabilityThe Dow Jones Industrial Average (DJI) closed at 41985 on Friday, up 0.08%, maintaining its position above critical support at 41330. The index has dropped more than 6% since the start of the pullback from highs of 45073 in January 2025. The long-term bullish price structure that has lasted over two years remains intact; however, a double-top formation at recent highs and the observed weakness in the current quarter suggest a vulnerability in the long-term price structure, particularly around 42732 and 42248. Should it fail to maintain support at 41330, the index could collapse below the bullish structure. If it holds above this critical support, a temporary rebound targeting 42248, 42732, and 43388 is possible before the price declines again.
Reflecting on past market corrections, the index fell 38% in February 2020 and 22% in January 2022. This time, the situation may differ due to the current political and economic climate shaped by the US administration. If we experience a four-stage pullback, the index could decline to 39062, 36794, and 34526, resulting in a correction of over 23%. Should it fall below 34526, there is potential for a deeper dive into bear territory, reaching 32257 with a correction exceeding 28%.

Easy tricks to master you mind during correctionsHello,
The markets have been correcting, and fear seems to be creeping in. What most investors fail to understand is that big corrections such as this are the best opportunities handed to them. This is the best time to buy since markets are trading at the bottom. Additionally, for this time earnings season is about to kick in while this time the market is trading at the bottom. We compiled a few things that can help you remain composed in the current market environment.
A transformative book I would recommend is Trading in the Zone by Mark Douglas. Douglas brilliantly compares elite traders to world-class athletes, revealing that both achieve greatness not through luck, but through rigorous mental discipline and robust, repeatable systems. To guide you toward this coveted "zone" of peak performance, here are four indispensable strategies:
Craft a Rock-Solid Trading Plan
A well-defined trading plan is your compass in the chaotic wilderness of the markets. It spells out precise conditions for entering trades, selecting opportunities, and exiting positions. By faithfully following this blueprint, you anchor yourself in accountability, sidestepping the pitfalls of reckless, emotion-driven moves.
Maintain a Detailed Trading Journal
Think of your trading journal as a mirror reflecting your journey. Record every trade, emotion, and market insight. This disciplined habit empowers you to evaluate your performance, pinpoint weaknesses, and sharpen your approach—unlocking a deeper understanding of your own psychological triggers.
Cultivate Confidence Through Realistic Goals
Confidence isn’t bravado—it’s the quiet strength to take calculated risks and embrace the results. Build it by practicing on a demo account with the seriousness of real stakes, setting attainable targets, and celebrating small wins. This foundation turns uncertainty into opportunity.
Master the Art of Risk Management
In trading, protecting your capital is paramount. Embrace proven techniques like setting risk/reward ratios, deploying stop losses, and sizing positions sensibly. These habits don’t just shield you from ruin—they pave the way for consistent, long-term gains.
With the above rules we believe you should be able to invest or remain invested during these volatile moments. Again, remember the tariffs that have been set are the ceiling and we expect concessions to come once negotiations between countries begin.
Good luck and stay invested. As shown in the chart, this is not the first time the market is undergoing a significant correction. What's clear is that markets always recover from corrections and continue pushing higher. This further reinforces our conviction that this are the best times to begin buying.
Disclosure: I am part of Trade Nation's Influencer program and receive a monthly fee for using their TradingView charts in my analysis.
