US30 STILL KEEPING 1800+ BEARISH PIPSWhatever the fundamentals linked to this bleeding of DJI but i am still looking for retest SELL before any form of LONG that may last till the kingdom come
US30 trade ideas

DOW/US30 - what the expectation from the marketTeam, last week we kill the market
I have prepare for the next week strategy
We currently have some small volume position long at this stage
and will add more if the market down to next level,
However, we expect some recovery at this stage.
Strategy:
TARGET 1 - 39266-39335
TARGET 2 - 39375-39467
TARGET 3 at 39600-39929
TARGET 4 at 40.400-41400 - run with mini volume and hold.

US30 Outlook on 4H TF - LONG US30 - Bullish Wave 5 Push to 42,000 📈
We're still in a Wave 4 correction on the daily, but price just retested Wave 4 lows at 38,900 area and held (for now). Now forming a double bottom on the 4H, and Wave 1 is starting on the 1H.
Looking for a Wave 5 push up toward 42,000 before a major selloff.
Key Levels:
🔹 Support: 38,970
🔹 TP Zones: 40,000 → 41,000 → 42,000
🔻 Short Bias kicks in after Wave 5 completes (Target: 38,100-38,200)
Plan: Buy dips while above 38,900, scale out near 42K, watch for reversal confirmation.

check the trendIt is expected that a trend change will form within the current support range and we will witness the start of an uptrend. Then, given the behavior of the indicator in the resistance range, the continuation of the movement trend will be determined.

Bearish drop?Dow Jones (US30) is reacting off the pivot nd could drop to the 1st support that lines up with the 61.8% Fibonacci extension.
Pivot: 39,291.00
1st Support: 37,024.36
1st Resistance: 40,624.32
Risk Warning:
Trading Forex and CFDs carries a high level of risk to your capital and you should only trade with money you can afford to lose. Trading Forex and CFDs may not be suitable for all investors, so please ensure that you fully understand the risks involved and seek independent advice if necessary.
Disclaimer:
The above opinions given constitute general market commentary, and do not constitute the opinion or advice of IC Markets or any form of personal or investment advice.
Any opinions, news, research, analyses, prices, other information, or links to third-party sites contained on this website are provided on an "as-is" basis, are intended only to be informative, is not an advice nor a recommendation, nor research, or a record of our trading prices, or an offer of, or solicitation for a transaction in any financial instrument and thus should not be treated as such. The information provided does not involve any specific investment objectives, financial situation and needs of any specific person who may receive it. Please be aware, that past performance is not a reliable indicator of future performance and/or results. Past Performance or Forward-looking scenarios based upon the reasonable beliefs of the third-party provider are not a guarantee of future performance. Actual results may differ materially from those anticipated in forward-looking or past performance statements. IC Markets makes no representation or warranty and assumes no liability as to the accuracy or completeness of the information provided, nor any loss arising from any investment based on a recommendation, forecast or any information supplied by any third-party.

Avoid Trading Indices on Long Weekends and Bank HolidaysTrading indices during long weekends or bank holidays can be risky due to lower liquidity and higher volatility. Many major financial institutions and market participants are away, leading to thinner trading volumes. This can cause exaggerated price swings, making it harder to execute trades at desired levels. Additionally, unexpected news or geopolitical events over the extended break can trigger sharp gaps when markets reopen, increasing the chances of significant losses.
Another key concern is the lack of immediate reaction time. Since markets are closed for an extended period, traders have no opportunity to adjust positions in response to breaking news. This can leave portfolios exposed to unforeseen risks. Spreads on indices also tend to widen during these times, increasing trading costs. For these reasons, it’s often safer to wait for normal trading conditions rather than risking unpredictable moves during illiquid holiday sessions.

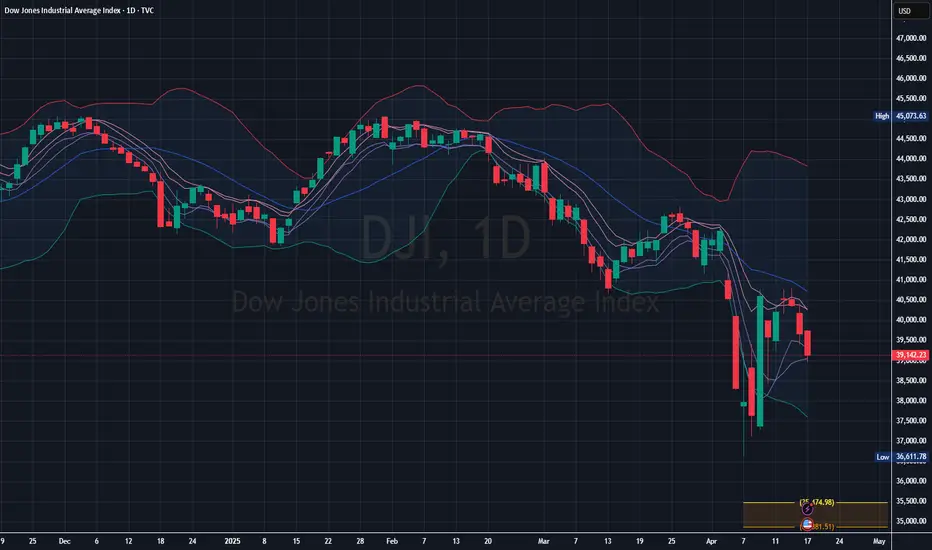
DJI Daily Chart Analysis: Price Rejected at Mid-Band Resistance
The price is below the middle line (likely a 20-day moving average) of the Bollinger Bands, which typically signals bearish momentum.
Recent price action shows a lower high and a lower low pattern, indicating the continuation of a downtrend.
The candlesticks are mostly red with increasing volume of selling pressure.
Bands are widening, suggesting increased volatility.
The price recently pierced the lower Bollinger Band, which often indicates a potential for short-term rebound—but in a strong downtrend, this could also mean acceleration to the downside.
Key Support Zone : Around 38,000 to 38,500, where previous buying occurred in early April. If broken, further downside to 37,000 is likely.
Key Resistance Zone : Near 40,500 to 41,000, aligning with the mid-Bollinger Band. This area has been tested and rejected multiple times.
The Dow Jones is in a downtrendIf the price breaks and holds below the psychological level of 39,000 — which is also a weekly resistance — we may see the 37,000 and 36,000 levels. However, it depends on the next weekly candle

Trade Idea: US30 Short (SELL STOP)Technical Analysis Summary:
Daily Chart (Macro View):
• Trend: Bearish short-term (price is below the moving average, sharp recent drop).
• MACD: Bearish momentum building with a deepening histogram.
• RSI: At 42.22, pointing down – no oversold condition yet, so further downside is probable.
15-Minute Chart (Mid-Term Momentum):
• Trend: Recently broke down from consolidation, failed to reclaim previous high.
• MACD: Strong bearish crossover, deep in negative territory.
• RSI: At 39.20, not oversold – room to fall.
3-Minute Chart (Entry Timing):
• Trend: Weak recovery attempt stalled below moving average.
• MACD: Flat to downtrend.
• RSI: Around 40, suggesting more downside pressure without being oversold.
⸻
Fundamental Context (if relevant to US30):
• Rising geopolitical tensions and weak earnings reports (assumed).
• Dovish Fed fading, bond yields rising — bearish for equities.
• Fear-driven sentiment often hurts cyclical indices like US30.
⸻
Trade Setup (SHORT):
• Entry: 39595 (current price area as per charts).
• Stop Loss (SL): 40087
(Above minor resistance and 15M consolidation top)
• Take Profit (TP): 38650
(Recent support zone, room for price to breathe before demand zone)
FUSIONMARKETS:US30

APRIL 14TH ANALYSIS FOLLOW THROUGH PT.2I closed my position at 39,100. I can still see it hitting the bull support zone from the channel but I'm happy with 700+ pips bagged for the week. For those that saw this and took advantage CHEERS!! I will be back next week for more analysis.

Potential bearish drop?DJ30 is reacting off the support level which is an overlap support and could drop from this level to our take profit.
Entry: 39,332.63
Why we like it:
There is an overlap support level.
Stop loss: 40,743.45
Why we like it:
There is an overlap resistance level.
Take profit: 37,047.85
Why we like it:
There is a pullback support level that is slightly below the 61.8% Fibonacci projection.
Enjoying your TradingView experience? Review us!
Please be advised that the information presented on TradingView is provided to Vantage (‘Vantage Global Limited’, ‘we’) by a third-party provider (‘Everest Fortune Group’). Please be reminded that you are solely responsible for the trading decisions on your account. There is a very high degree of risk involved in trading. Any information and/or content is intended entirely for research, educational and informational purposes only and does not constitute investment or consultation advice or investment strategy. The information is not tailored to the investment needs of any specific person and therefore does not involve a consideration of any of the investment objectives, financial situation or needs of any viewer that may receive it. Kindly also note that past performance is not a reliable indicator of future results. Actual results may differ materially from those anticipated in forward-looking or past performance statements. We assume no liability as to the accuracy or completeness of any of the information and/or content provided herein and the Company cannot be held responsible for any omission, mistake nor for any loss or damage including without limitation to any loss of profit which may arise from reliance on any information supplied by Everest Fortune Group.

Dow jones 38500?Dow jones 38500?
The Dow Jones Industrial Average (DJIA) has been experiencing volatility recently, influenced by factors such as weak earnings reports and global economic concerns. The index fell 507 points (1.3%) in its latest session, primarily due to a sharp decline in UnitedHealth shares following an earnings miss

US30selling us30 now 40,320
sl 41,255
tp 37,867
risk 1% each trade .
like an follow for more post.
pre open market setup


DOW/US30Team, time to go long DOW/US30
yesterday the market disappointed on the FED decision,
i just cant believe the FED compare the inflation in 2020-2021 that is where the COVID and lock down. And compare to 2024. he should have cut the interest rate to ease the market.
Given the fact the market is dropping 1000 points, i expect we should have some recover at least 200-300 points medium
Target 1 at 39225
Target 2 at 39335-39420
Target 3 at 39560-39670
We should see the market pump in 2-3 hour time frame or recover.


Dow INTRADAY key resistance at 41333Key Support and Resistance Levels
Resistance Level 1: 41333
Resistance Level 2: 42000
Resistance Level 3: 42800
Support Level 1: 39220
Support Level 2: 37554
Support Level 3: 36620
This communication is for informational purposes only and should not be viewed as any form of recommendation as to a particular course of action or as investment advice. It is not intended as an offer or solicitation for the purchase or sale of any financial instrument or as an official confirmation of any transaction. Opinions, estimates and assumptions expressed herein are made as of the date of this communication and are subject to change without notice. This communication has been prepared based upon information, including market prices, data and other information, believed to be reliable; however, Trade Nation does not warrant its completeness or accuracy. All market prices and market data contained in or attached to this communication are indicative and subject to change without notice.

DOW JONES / US30There is a possibility of price correction from the range of 38903.71 towards 39915 and it can be entered as a trade.

Dow Jones Wave Analysis – 17 April 2025
- Dow Jones reversed from the resistance zone
- Likely to fall to support level 38500.00
Dow Jones index recently reversed down from the resistance zone between the resistance level 40815,00 (former strong support from the start of March), 20-day moving average and the 61.8% Fibonacci correction of the downward impulse from last month.
The downward reversal from this resistance zone stopped the previous minor correction (iv) from the start of April.
Given the clear daily downtrend, Dow Jones index can be expected to fall to the next support level 38500.00.

US30We can attempt to buy US30 from specified level as it make HL , also there is no bearish divergence occur indicate that it moves upward.

US30/ Dow jonesConsidering the high that was hit during London session, I’m waiting to see what happens during the New York session. If that high breaks, I’ll look to buy; if not, I’ll be selling.
