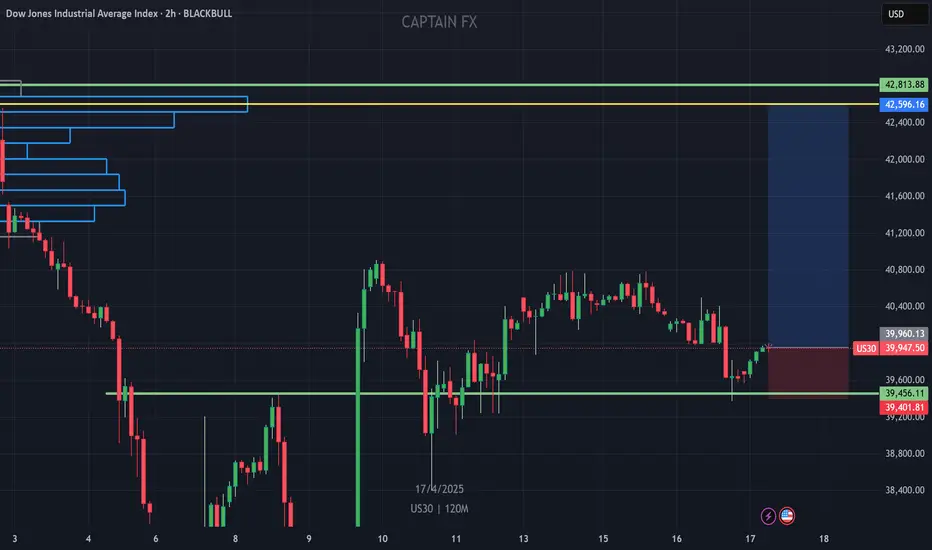
US30 BUY NOW!!!!!!!!US30 created a double bottom on the 2h chart price have already made a retest off the neckline region am in again on buys holding to see price arrive at the POC level
JOIN AND ENJOY........
US30 trade ideas
Dow Jones Update: Downside Pressure PersistsI currently estimate that the Dow Jones is in the early stage of wave B of wave (B), as indicated by the black label. This suggests that the index may continue its correction, potentially testing the 38,200–39,186 area before rebounding to challenge the resistance zone around 40,791 and possibly filling the gap between 41,173 and 41,629.
However, under the more bearish scenario (red label), the selling pressure on the Dow Jones remains significant, which may result in the formation of wave , leading to a deeper correction below the 36,611 level.

Trade Idea: US30 Short ( SELL LIMIT )Technical Overview:
Daily Chart:
• Clear downtrend with price sharply rejecting from recent highs (~42890).
• MACD shows strong bearish momentum with a widening histogram.
• RSI is below 50 at ~45, confirming downside pressure.
• Price has broken below a key support level near 40200, now acting as resistance.
15-Min Chart:
• Recent lower highs and lower lows.
• MACD negative, with RSI nearing oversold (33), suggesting bearish bias but short-term exhaustion.
3-Min Chart:
• Sideways chop after a sharp down move, showing bear flag/consolidation pattern.
• MACD still negative, RSI around 49—no clear bounce signal.
⸻
Fundamental Overview:
• Recent macro uncertainty (possibly due to inflation/Fed comments or geopolitical tensions) likely weighs on risk sentiment.
• Bond yields are likely pressuring equities, and the US30 tends to be rate-sensitive.
⸻
Trade Setup: SHORT
• Entry: 40250 (if price pulls back slightly into minor resistance zone)
• Stop Loss: 40500 (above recent local high on intraday chart)
• Take Profit: 39600 (next strong daily support level)
FUSIONMARKETS:US30

Us30What I have realized is price is ranging in between HOD and LOD using inside multiple rejection zones to confuse me,so for now I want to see if it will buy till the HOd since I spotted a ranging market

key levelsdon't you just like looking at key levels
when I don't know but it could be scary but if it does, I mean we have to make the year 2025 become invaded due to years of no real growth other than speculation and hype to not see a nasty move down
I would really love to see next quarter show something of stabilize growth if not well then, I'm beating that the us will fall


April 14th analysis follow through The sell off analysis from April 14th is currently up by 558 pips at the moment as I type this out. I currently have 3 entries in this sell to bull support off the 2nd low on April 10th.


US30 Best 2 Places To Buy To Get 1000 Pips , Are You Ready ?Here is my opinion on US30 , If we are talking about buy , so this is the best 2 places to can buy it , first one , it`s an old res and working as new supp now , and it`s my fav place to buy , second one we need a Daily closure above this strong res to confirm that the price will continue to upside , and then we can wait he price to go back to retest the broken area and enter a buy trade and targeting 1000 pips .
This Is An Educational + Analytic Content That Will Teach Why And How To Enter A Trade
Make Sure You Watch The Price Action Closely In Each Analysis As This Is A Very Important Part Of Our Method
Disclaimer : This Analysis Can Change At Anytime Without Notice And It Is Only For The Purpose Of Assisting Traders To Make Independent Investments Decision


DOW fulfilled all Market Bottom conditions. 2year rally started!Dow Jones (DJI) has cemented a strong Support zone last week. Not only did it almost test its 1W MA200 (orange trend-line) and successfully held but also the former All Time High (ATH) Resistance trend-line that started from the previous Cycle Top and now turned into Support.
This previous ATH trend-line held and offered its Support on the previous 2 major market bottoms as well (October 03 2022 and March 23 2020). Actually on all 3 previous Cycle bottoms that turned out to be the best level to buy long-term, the 1W RSI was oversold on the 30.00 limit.
All the above conditions were fulfilled on last week's (April 07 2025) Low. Even though Dow is expected to reach 53000 on its next Top in around 2 years, the most optimal Sell Signal has been given by the 1W RSI. After the 1W RSI breaks for the first time above the 70.00 overbought limit again, the best Sell Signal would be after it drops and re-tests again 70.00 for the 2nd time.
-------------------------------------------------------------------------------
** Please LIKE 👍, FOLLOW ✅, SHARE 🙌 and COMMENT ✍ if you enjoy this idea! Also share your ideas and charts in the comments section below! This is best way to keep it relevant, support us, keep the content here free and allow the idea to reach as many people as possible. **
-------------------------------------------------------------------------------
Disclosure: I am part of Trade Nation's Influencer program and receive a monthly fee for using their TradingView charts in my analysis.
💸💸💸💸💸💸
👇 👇 👇 👇 👇 👇

Hanzo | US30 15 min Breaks – Will Confirm the Next Move🆚 US30
The Path of Precision – Hanzo’s Market Strike
🔥 Key Levels & Breakout Strategy – 15M TF
🔥 Deep market insight – no random moves, only calculated execution.
☄️ Bullish After Break Out – 40850 Zone
Price must break liquidity with high volume to confirm the move.
☄️ Bearish After Break Out – 40400 Zone
Price must break liquidity with high volume to confirm the move.
🩸 15M Time Frame Confluence
————
CHoCH & Liquidity Grab @ 4850
Key Level / Equal lows Formation - 40400
Strong Rejection from 40790 – The Ultimate Pivot
Strong Rejection from 39900 – The Ultimate Pivot
🔥 1H Time Frame Confirmation
Twin Wicks @ 40500 – Liquidity Engineered
Twin Wicks @ 39850 – Liquidity Engineered
Twin Wicks @ 40800 zone – Liquidity Engineered

US30 Trade Update – 16/04/2025 🚨 US30 Trade Update – 16/04/2025 🚨
📉 Bearish Shift Underway!
US30 has failed to break above the key 40,701 resistance and is now rolling over. Price is losing momentum with a clean rejection and EMA crossover suggesting downside pressure building.
🔍 Key Observations:
❌ Rejection at 40,701 resistance
🔻 Price now trading below EMA 8 & 21
⚠️ 40,060 is the immediate support to watch
🧨 Clean break below → downside opens toward 39,279
🎯 Trade Plan:
🔻 Short below 40,060 → Target 39,279
🔹 Long only above 40,701 → Target 41,200+
🕵️ Wait for volume confirmation before entry
📌 Structure is weakening — bulls must act fast, or bears will take full control.

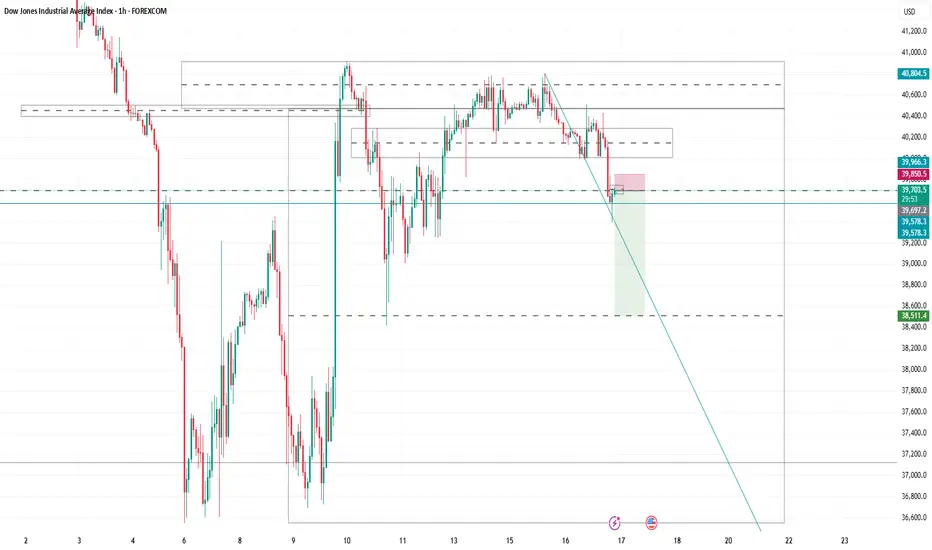
US30 (H4)US30 has formed a potential Double M (double top) pattern, indicating a possible bearish reversal. Price has tested the resistance zone twice and failed to break higher, suggesting weakening bullish momentum. If neckline support breaks with volume confirmation, this could present a shorting opportunity targeting lower support levels.

DOW/US30 - RETAIL DATA AND POWELL SPEECHTeam,
The market has been a roller coaster due to the Trump Tariff plan
. We are in an entry long position now but with small volume only.
The current for US30 price is 40248
We are using a swing stop loss at 40120
Once the price reaches above 40300, bring stop loss to BE
the data consensus shows that 700% retail increase is more than last month.
this will likely support the market. Also, Trump's tariff plan would improve exports and bring down the DOLLAR.
Therefore, if you are risking a trade 1R buts 5R as a reward
Please assess your risk and make the decision.
NOTE: However, if the price drop toward 39800-39200, I will double and triple my money on long position
will get our money back easily.
Every trade you enter requires a risk and reward
ask yourself and analyst carefully
We can easily get 40300 then bring stop loss to BE for target the range above

DOW JONES Free Signal! Sell!
Hello,Traders!
US30 made a nice bullish
Rebound from the lows it
Plunged towards during the
High volatility of the last weeks
But now that the market seems
To have calmed down a bit we
Are seeing a retest of the
Horizontal resistance of 40,725
And a local pullback so we are
Locally bearish biased, therefore
We can enter a short trade
With the Take Profit of 39,700
And the Stop Loss of 40,956
Sell!
Comment and subscribe to help us grow!
Check out other forecasts below too!
Disclosure: I am part of Trade Nation's Influencer program and receive a monthly fee for using their TradingView charts in my analysis.

US30 Gearing Up for a Monster Move – Bulls or Bears?🔍 Price is stalling just below the 40,770.00 resistance, showing signs of exhaustion after a strong bullish push. Momentum is slowing down.
📌 Marked Zones:
• Resistance: 40,770.00 ❌ | 41,552.00 🔼 | 42,540.00 🔼
• Support: 39,270.00 ⚠ | 36,800.00 🛡
📈 Scenarios:
• Bullish Bias: A clean break and retest above 40,770.00 could open the door for a continuation to 41,552.00.
• Bearish Bias: Rejection from 40,770.00 or failure to break higher could trigger a retracement to 39,270.00 or lower.
⚠ Stay patient and watch price behavior around the zone — no breakout, no buy.
📘 This is not financial advice. Always trade your plan.

"US30/DJI30" Index CFD Market Heist Plan (Scalping/Day Trade)🌟Hi! Hola! Ola! Bonjour! Hallo! Marhaba!🌟
Dear Money Makers & Robbers, 🤑 💰💸✈️
Based on 🔥Thief Trading style technical and fundamental analysis🔥, here is our master plan to heist the "US30/DJI30" Index CFD Market. Please adhere to the strategy I've outlined in the chart, which emphasizes long entry. Our aim is to escape near the high-risk MA Zone. Risky level, overbought market, consolidation, trend reversal, trap at the level where traders and bearish robbers are stronger. 🏆💸"Take profit and treat yourself, traders. You deserve it!💪🏆🎉
Entry 📈 : "The heist is on! Wait for the MA breakout (40800) then make your move - Bullish profits await!"
however I advise to Place Buy stop orders above the Moving average (or) Place buy limit orders within a 15 or 30 minute timeframe most recent or swing, low or high level for Pullback entries.
📌I strongly advise you to set an "alert (Alarm)" on your chart so you can see when the breakout entry occurs.
Stop Loss 🛑: "🔊 Yo, listen up! 🗣️ If you're lookin' to get in on a buy stop order, don't even think about settin' that stop loss till after the breakout 🚀. You feel me? Now, if you're smart, you'll place that stop loss where I told you to 📍, but if you're a rebel, you can put it wherever you like 🤪 - just don't say I didn't warn you ⚠️. You're playin' with fire 🔥, and it's your risk, not mine 👊."
📍 Thief SL placed at the recent/swing low level Using the 1H timeframe (39200) Day trade basis.
📍 SL is based on your risk of the trade, lot size and how many multiple orders you have to take.
🏴☠️Target 🎯: 42700 (or) Escape Before the Target
🧲Scalpers, take note 👀 : only scalp on the Long side. If you have a lot of money, you can go straight away; if not, you can join swing traders and carry out the robbery plan. Use trailing SL to safeguard your money 💰.
💰💵💴💸"US30/DJI30" Index CFD Market Heist Plan (Day / Scalping Trade) is currently experiencing a bullishness🐂.., driven by several key factors.👇👇👇
📰🗞️Get & Read the Fundamental, Macro, COT Report, Quantitative Analysis, Sentimental Outlook, Intermarket Analysis, Future trend targets... go ahead to check 👉👉👉🔗🔗
⚠️Trading Alert : News Releases and Position Management 📰 🗞️ 🚫🚏
As a reminder, news releases can have a significant impact on market prices and volatility. To minimize potential losses and protect your running positions,
we recommend the following:
Avoid taking new trades during news releases
Use trailing stop-loss orders to protect your running positions and lock in profits
💖Supporting our robbery plan 💥Hit the Boost Button💥 will enable us to effortlessly make and steal money 💰💵. Boost the strength of our robbery team. Every day in this market make money with ease by using the Thief Trading Style.🏆💪🤝❤️🎉🚀
I'll see you soon with another heist plan, so stay tuned 🤑🐱👤🤗🤩

US30: The Market Is Looking Down! Short!
My dear friends,
Today we will analyse US30together☺️
The market is at an inflection zone and price has now reached an area around 40,580.88 where previous reversals or breakouts have occurred.And a price reaction that we are seeing on multiple timeframes here could signal the next move down so we can enter on confirmation, and target the next key level of 40,403.97..Stop-loss is recommended beyond the inflection zone.
❤️Sending you lots of Love and Hugs❤️

time to sell DOW again!!!in my idea we r in wave 4 and its almost ended here...so we will sell it to catch wave 5 down...use SL and TP for u r trades so be careful about u r money

Daily Price Action: Dow Jones DJI Tuesday 4/15/2025In this video, we are looking into the potential daily price action of DJI.

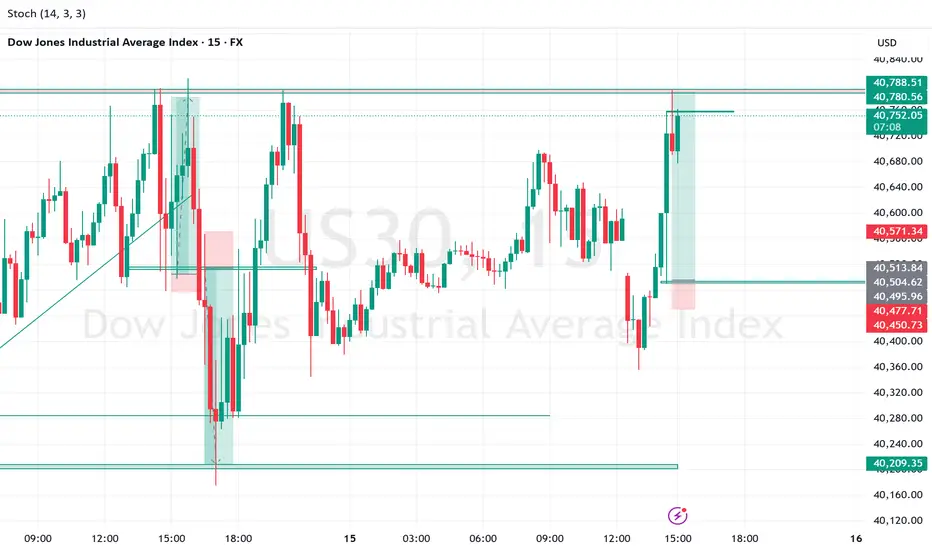
us30 longKey Observations:
Strong Bullish Momentum (Preceding the current candle):
There was a significant bullish move leading up to 15:00, with large green candles pushing price from around 40,570 to 40,770.
This sharp upward move could be news-driven or reacting to a key level.
Current Candle Showing Rejection:
The latest 5-minute candle (red) shows a possible rejection at resistance around 40,780–40,790, where price has wicked to the upside but closed lower.
Indicates possible profit-taking or short-term reversal.
Overbought on Stochastic:
Stochastic Oscillator (14, 3, 3) is at 86.07 and 90.67 — in the overbought zone.
Suggests potential for pullback or sideways movement unless momentum continues.
Resistance & Support Levels:
Resistance Zone: ~40,780–40,788 (previous highs + possible supply zone).
Support Zone: ~40,571 (previous consolidation area and marked SL level).
If price breaks below ~40,690 with volume, watch for a dip toward 40,570 or 40,513.