PUMP/USDTCurrent Market Structure
Strong pump occurred around July 13th, peaking above 0.0072.
Price retraced and is now ranging between 0.00580 – 0.00640.
Appears to be forming a consolidation or flag pattern, which can break either way.
Volume is declining, indicating potential for breakout buildup.

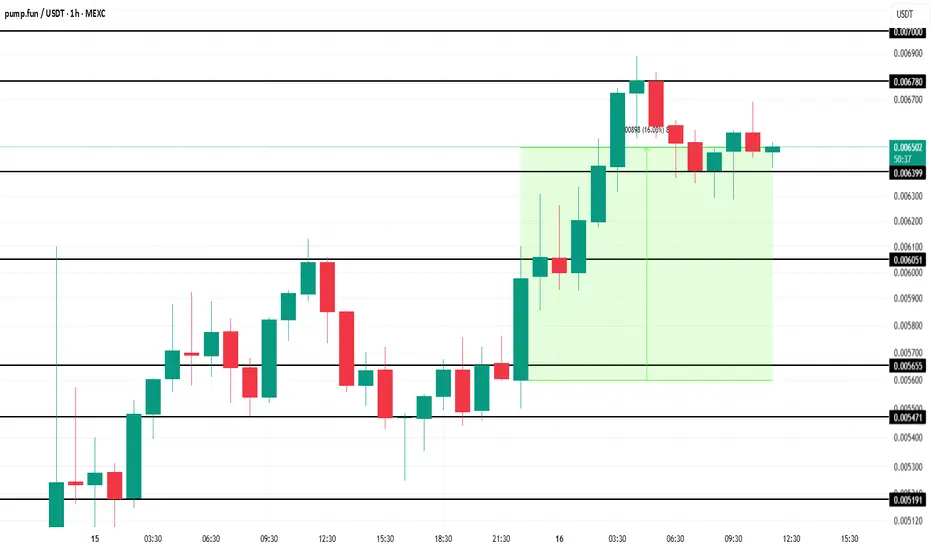
Pump.Fun (PUMP) Token Nears Milestone $1 Billion OI In 3 DaysMEXC:PUMPUSDT price stands at $0.0065 after bouncing off the $0.0063 support level. The token has gained 16% in the last 12 hours , showing that the demand for PUMP is strong.
The valuation of Pump.Fun has skyrocketed in just two days, reflecting a surge in demand. In only 48 hours since its laun
#PUMP is trying to break out of the falling channel! #PUMP Our previous trade setup, SL, got hit.
Currently, it is trying to break out of the falling channel on the 1H chart.
If it holds above the breakout zone, it could push toward $0.0082 📈
Entry: 0.0060 – 0.0063
Stop Loss: 0.00578
Targets:
TP1: 0.0068
TP2: 0.0074
TP3: 0.00795
TP4: 0.00823
Class


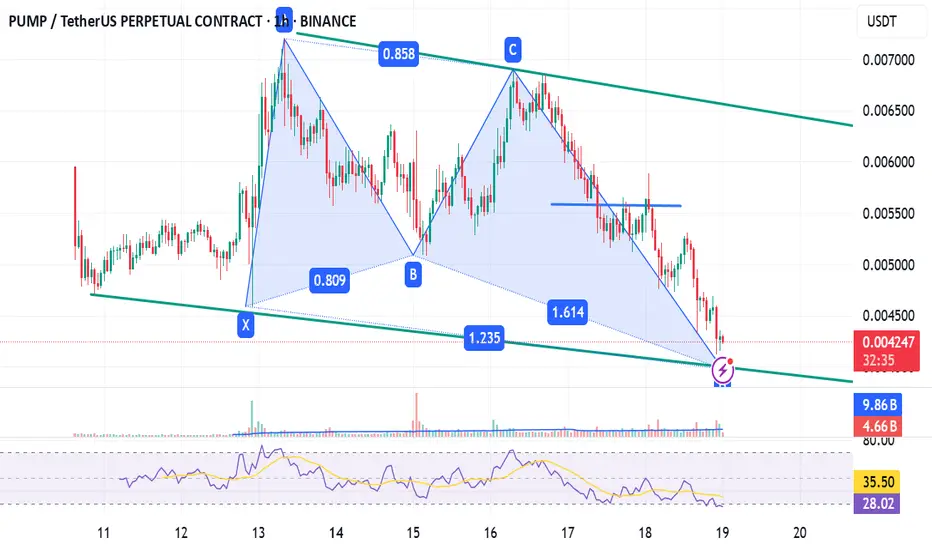
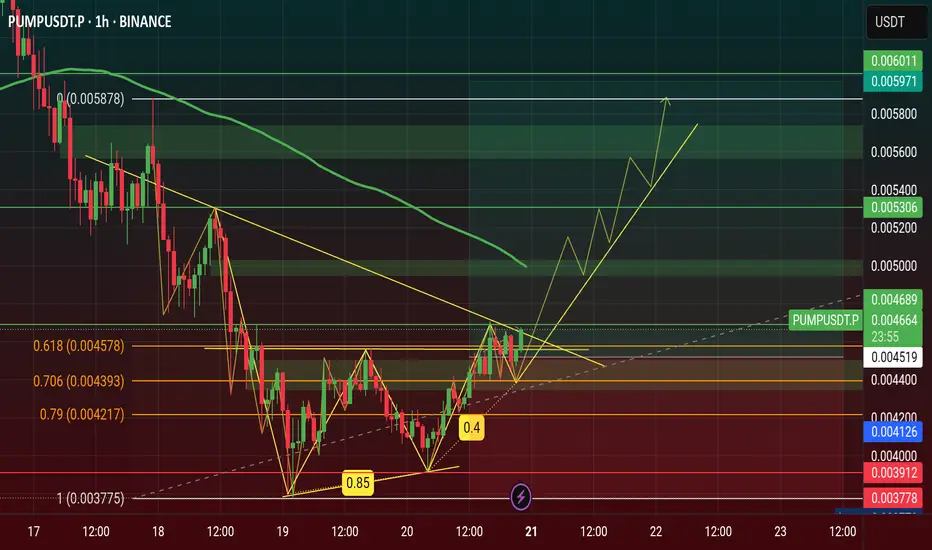
pumpusdt bullish butterfly harmonic patternpossibility forming butterfly harmonic pattern.
but the counter is still in down trend.
counter may fell deeper, high possibility anyway.
may look for entry after change market structure with choch in 1hr tf, then only consider it.
must wait for confirmation with test 1st only consider.
next pote
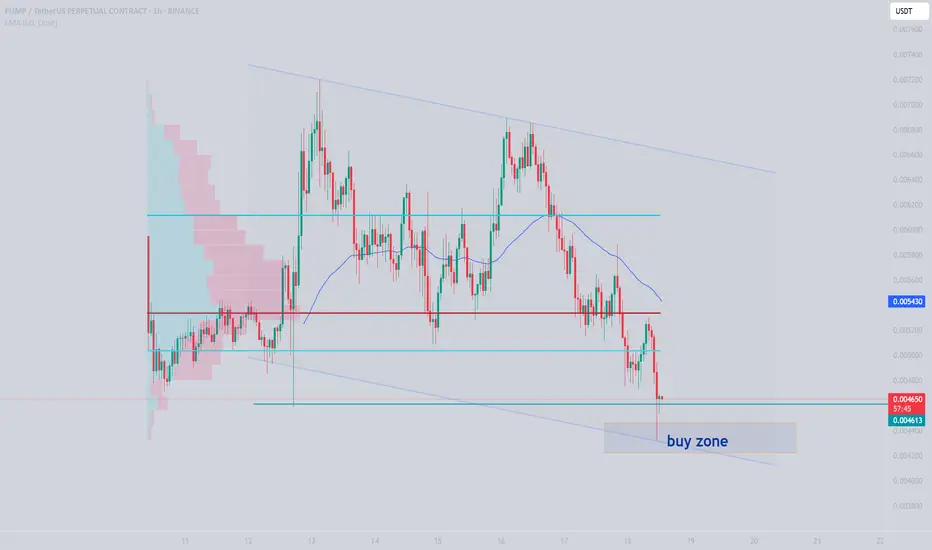
pumpusdtGiven the current price conditions and the attention this token has garnered, it is worth taking a risk step at the bottom of its descending channel for much higher targets.
Pump token. Long after correction!📈 PUMP/USDT – Long Setup on Structural Support | Fib & Gaussian Confluence
PUMP is currently experiencing a short-term rejection from local resistance, and has broken below the rising black trendline, now retesting it from the underside — a common bearish retest. Additionally, a short signal (red d

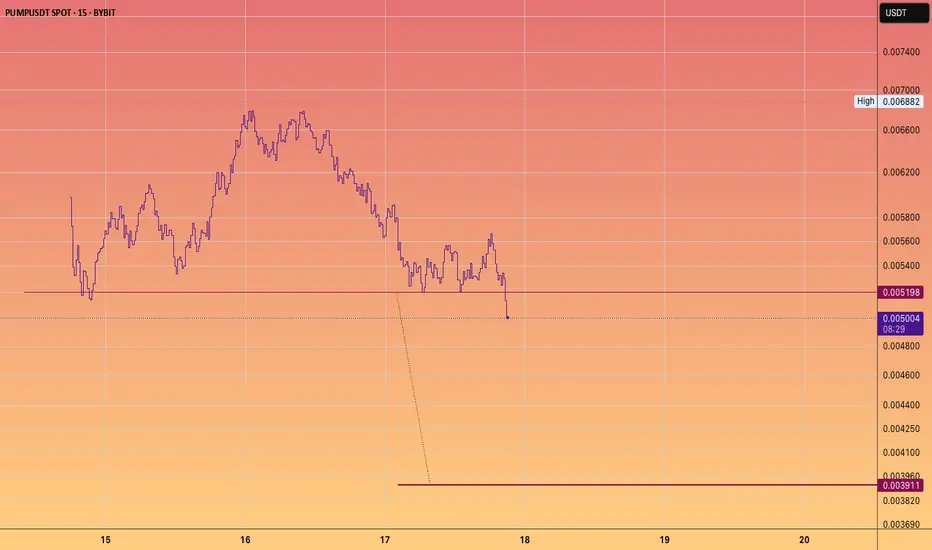
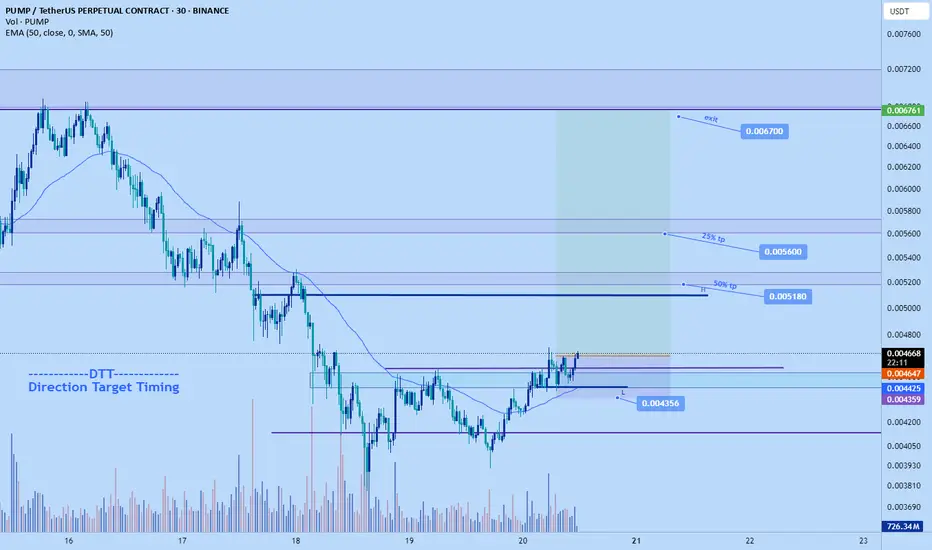
Pumpdotfun long back to $0.0067+pumpdotfun Long
Sl: $0.004356
Tp1: $0.005180---50%
Tp2: $0.0056---25%
Exit: $0.0067
DT strategy applied.
Time sensitive
$PUMP Price Will Hit $0.006 this July 2025 see on Chart...🚀 NYSE:PUMP Price Will Hit $0.006 this July 2025, NYSE:PUMP is Showing a Double Bottom Pattern Looking on Chart now.
Double Bottom Pattern is a Reversal Pattern and It's will Manipulation Price of Pump. I'm Find a Three White Shoulders Candle in bottom price area on 4h Chart & It is a Bullish
See all ideas
Summarizing what the indicators are suggesting.
Oscillators
Neutral
SellBuy
Strong sellStrong buy
Strong sellSellNeutralBuyStrong buy
Oscillators
Neutral
SellBuy
Strong sellStrong buy
Strong sellSellNeutralBuyStrong buy
Summary
Neutral
SellBuy
Strong sellStrong buy
Strong sellSellNeutralBuyStrong buy
Summary
Neutral
SellBuy
Strong sellStrong buy
Strong sellSellNeutralBuyStrong buy
Summary
Neutral
SellBuy
Strong sellStrong buy
Strong sellSellNeutralBuyStrong buy
Moving Averages
Neutral
SellBuy
Strong sellStrong buy
Strong sellSellNeutralBuyStrong buy
Moving Averages
Neutral
SellBuy
Strong sellStrong buy
Strong sellSellNeutralBuyStrong buy