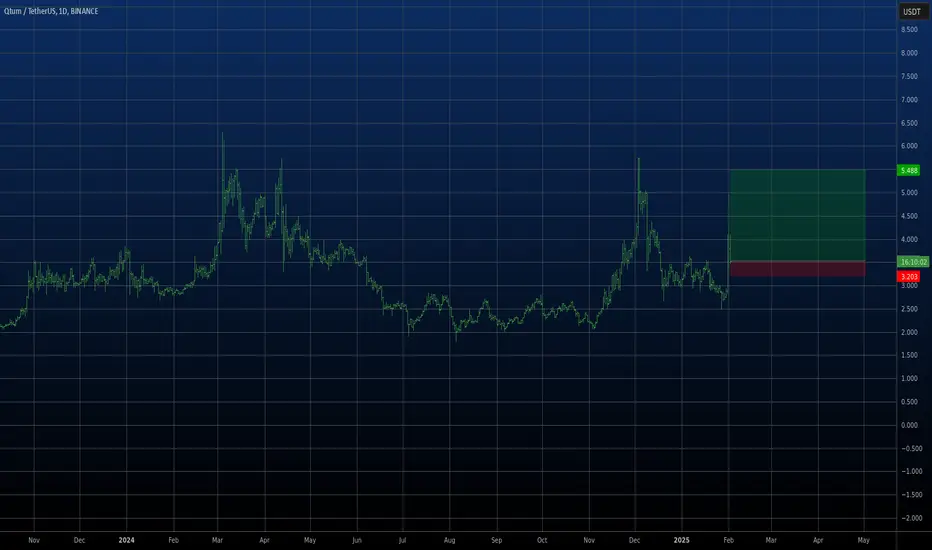
SPOT QTUM LONG 23.02.2025Pinning after exhaustion of sales.
💰I enter at the market price.
I'll let you know when I record it manually.
‼️Risk per trade: 1% of the allocated funds for spot trading.
Thank you!
QTUMUSDT trade ideas

QTUM ANALYSIS🚀#QTUM Analysis :
🔮As we can see in the chart of #QTUM that after consolidation there was a huge bullish move. Right now we could see #QTUM is trading around its major resistance zone. After the breakout we would see a good bullish move
⚡️What to do ?
👀Keep an eye on #QTUM price action. We can trade according to the chart and make some profits⚡️⚡️
#QTUM #Cryptocurrency #TechnicalAnalysis #DYOR

QTUMUSDT UPDATEQTUMUSDT is a cryptocurrency trading at $3.555. Its target price is $5.500, indicating a potential 50%+ gain. The pattern is a Bullish Falling Wedge, a reversal pattern signaling a trend change. This pattern suggests the downward trend may be ending. A breakout from the wedge could lead to a strong upward move. The Bullish Falling Wedge is a positive signal, indicating a potential price surge. Investors are optimistic about QTUMUSDT's future performance. The current price may be a buying opportunity. Reaching the target price would result in significant returns. QTUMUSDT is poised for a potential breakout and substantial gains.

QTUM for a LONGQTUM looking good today on a pullback to FVG on the 4H chart at $3.00, maybe even to $2.95 , for a LONG. aVWAP's (Purple and White Lines) are at 3.60-3.68 but I would be looking for a take profit at ~4.23
Need to see volume and open interest at these levels though - sentiment is good for QTUM with hard fork success this week.

QTUM to 20$ soonQtum is a decentralized blockchain network that supports smart contracts using the Ethereum Virtual Machine. The blockchain itself is based on Bitcoin’s UTXO model, but uses proof-of-stake for consensus. Because Qtum is a hybrid project that takes the best parts of Ethereum and Bitcoin, it also has the ability to merge future updates from these projects and place them on top of the Team’s own unique developments.


Long QTUMThe good moment for try to Buy the QTUM. We are a ling time in the flat channel. And now we a tested the up level and do not touch the low level. It can be support point. After fast move up and back we can to stop on the middle line of flat channel and start to move up creating up trend. The good trade with small risk and good reward. Will see...
Important support and resistance zones: 2.950-3.403
Hello, traders.
If you "Follow", you can always get the latest information quickly.
Please also click "Boost".
Have a nice day today.
-------------------------------------
(1D chart)
The M-Signal indicators of 1D, 1W, and 1M charts are concentrated in the 2.950-3.403 section.
Accordingly, when the StochRSI indicator shows a downward trend in the overbought section, whether there is support near this section is an important issue.
-
(30m chart)
In order to change the trend, the MS-Signal indicator must rise above the price and maintain the price.
If the MS-Signal indicator rises above the price, the BW (100) indicator is formed at the 3.922 point and the HA-High indicator is formed at the 4.033 point, so the point to watch is whether this section can be broken upward.
When the StochRSI indicator enters the oversold zone and then rises, you should check for support near the 2.950-3.403 zone.
When you meet the HA-Low and BW(0) indicators, it is natural to enter a buy (LONG) position because there is a high possibility of an increase.
However, as I mentioned earlier, you should respond based on whether there is support near this area because you need to break through the MS-Signal indicator upward.
-
Rather than deciding how far it will fall or rise, it is important to consider which points are important support and resistance points and create a trading strategy based on whether there is support at those points.
Then, if you have traded according to the price movement, you can respond with a split transaction.
We are not analyzing charts, but trading to make profits, so you can respond appropriately and go with the flow.
-
Thank you for reading to the end.
I hope you have a successful trade.
--------------------------------------------------
- Big picture
I used TradingView's INDEX chart to check the entire range of BTC.
(BTCUSD 12M chart)
Looking at the big picture, it seems to have been maintaining an upward trend following a pattern since 2015.
In other words, it is a pattern that maintains a 3-year upward trend and faces a 1-year downward trend.
Accordingly, the upward trend is expected to continue until 2025.
-
(LOG chart)
Looking at the LOG chart, you can see that the upward trend is decreasing.
Accordingly, the 46K-48K range is expected to be a very important support and resistance range from a long-term perspective.
Therefore, I expect that we will not see prices below 44K-48K in the future.
-
The Fibonacci ratio on the left is the Fibonacci ratio of the uptrend that started in 2015.
That is, the Fibonacci ratio of the first wave of the uptrend.
The Fibonacci ratio on the right is the Fibonacci ratio of the uptrend that started in 2019.
Therefore, this Fibonacci ratio is expected to be used until 2026.
-
No matter what anyone says, the chart has already been created and is already moving.
It is up to you how to view and respond to it.
Since there is no support or resistance point when the ATH is updated, the Fibonacci ratio can be appropriately utilized.
However, although the Fibonacci ratio is useful for chart analysis, it is ambiguous to use it as a support and resistance role.
The reason is that the user must directly select the important selection points required to create the Fibonacci.
Therefore, it can be useful for chart analysis because it is expressed differently depending on how the user specifies the selection point, but it can be seen as ambiguous for use in trading strategies.
1st: 44234.54
2nd: 61383.23
3rd: 89126.41
101875.70-106275.10 (when overshooting)
4th: 134018.28
151166.97-157451.83 (when overshooting)
5th: 178910.15
-----------------

SPOT QTUM LONG 2.01.2025Pinning after abnormal activity.
🎯Purpose:
4.784
I'll let you know when I record it manually.
‼️Risk per trade: 1% of the allocated funds for spot trading.
Thank you!

QTUMUSDT(Quantum) Updated till 01-02-25QTUMUSDT(Quantum) Daily timeframe range. we can see a nice push here. tried to break through 4.564. but bag holders took out profit at 4.564 so buyers needs to hold above 3.529 to continue the push. PA holding on its midrange decently for a while now.

QTUMUSDT 1WQTUM ~ 1W
#QTUM If you still have Conviction on this coin,. This support block would be a very good buying place for now,. With a minimum target of 20%++

SPOT QTUM LONG 15.12.2024🎯Purpose:
5.143
‼️Risk per trade: 0.5% of the allocated funds for spot trading.
There is more information in my channel.

$NEO $TRX $QTUMNASDAQ:NEO CRYPTOCAP:TRX NASDAQ:QTUM
After a massive surge, Neo, Tron and Qtum are experiencing a correction phase💁♂️
As long as the dashed supports holds, expect a bullish continuation towards previous major highs📈

SPOT QTUM LONG 8.12.2024🎯Purpose:
6.122
‼️We enter at 0.5% of the allocated money for spot trading.
There is more information in my channel.

QTUM LongPrice broke above resistance at 4.2 to a high of 5.7.
Retracement into supply zone around 4.6 now acting as short term support.
Long opportunity to 6.2.

SPOT QTUM LONG 29.11.2024🎯Purpose:
4,721
‼️We enter at 0.5% of the allocated money for spot trading.

QTUM ShortSupply zone formed between 3.99 and 3.763. Acting as new resistance .
If price drops should find support within rectangle . Probable area is demand zone around 2.5/2.2

$Qtumusdt 40% profit ideaHello everyone, as you know we closed our first trade with 35% profit. now it is time to think future. Im expecting a pull back starting from $4 to $3. thats the price we will look for buy. once pull back completed expecting an other rally till $4.7
please take a look the chart to see prices that sell and buy prices.
enjoy
** Please show your support if you like to see more idea from me. LIKE 👍, FOLLOW ✅, SHARE 🙌 and COMMENT ✍ if you enjoy this idea! Also share your ideas and charts in the comments section below! This is best way to keep it relevant, support me, keep the content here free and allow the idea to reach as many people as possible. **
#trading #BTC #bitcoin #coin #scalping #crypto

QTUMUSDT Approaches Rectangle Pattern ResistanceQTUMUSDT Technical analysis update
QTUMUSDT has been trading within a rectangle pattern for the last 150 days at the bottom yearly support. The price is now moving toward the rectangle resistance, and once a breakout occurs, a strong bullish move can be expected. The price is trading above the 100 and 200 EMAs, and there has been a noticeable rise in volume over the past few days.
Regards
Hexa

$Qtumusdt ready for 35% gainhi everyone, we are looking 30% pump on this shit, be ready to bank again. based on waves Im expecting good profit. follow my chart for prices .

QTUM LongLooking at higher time frame QTUM price is in the process of bullish rectangle move.
Already broke out and closed above 2.792 resistance.
Looking at 1 hr bull pennant is forming on the pull back . Good long potential

Bullish Breakout or Bearish Breakdown Ahead for #QTUMUSDT?Yello Paradisers! Are we on the verge of a bullish breakout or could a bearish breakdown be looming for #QTUMUSDT?
💎#QTUMUSDT has been trading within a tight consolidation range, hovering between a strong support at $2.040 and a key resistance at $2.789. This prolonged sideways movement reveals a market in equilibrium, with neither buyers nor sellers taking full control just yet. Typically, such consolidation phases set the stage for a significant price move once one side gains dominance.
💎Currently, all eyes should be on the $2.789 resistance level. If #QTUM breaks above this threshold with substantial trading volume, it could kick off a sharp upward move, with the next major target at $4.592. Throughout this consolidation, trading volume has remained relatively stable, but a surge could be the catalyst needed for a breakout. The RSI is showing neutral-to-bullish momentum, supporting the potential for an upward trend if resistance is broken.
💎However, if #QTUM fails to breach this resistance, we could see either a retest of the support level at $2.016 or continued sideways action. A strong rebound from this support would maintain the bullish outlook, while a breakdown below $2.016 could invalidate this setup and signal a shift towards bearish sentiment.
Stay disciplined, Paradisers. In moments like these, patience and timing are key. Don’t let market noise disrupt your strategy this could be a pivotal point, but only for those who play it smart and steady.
MyCryptoParadise
iFeel the success🌴

#QTUM (SPOT- Investing ) entry (1.880- 2.370). SL (1.784)BINANCE:QTUMUSDT
entry range (1.880- 2.370)
Target1 (3.290) - Target2 (4.960) - Target3 (7.740) - Target4 (10.499) - Target5 (13.199)
1 Extra Targets(optional) in chart, if you like to continue in the trade with making stoploss very high.
SL .1D close below (1.784)
** This coin may take long time to achieve all targets **
*** collect the coin slowly in the entry range ***
*** No FOMO - No Rush , it is a long journey ***
**** #Manta ,#OMNI, #DYM, #AI, #IO, #XAI , #ACE #NFP #RAD #WLD #ORDI #BLUR #SUI #Voxel #AEVO #VITE #APE #RDNT #FLUX #NMR #VANRY #TRB #HBAR #DGB #XEC #ERN #ALT #IO #ACA #HIVE #ASTR #ARDR #PIXEL #LTO #AERGO #SCRT #ATA #HOOK #FLOW #KSM #HFT #MINA #DATA #SC #JOE #RDNT #IQ #CFX #BICO #CTSI #KMD #FXS #DEGO #FORTH # AST #PORTAL #CYBER #RIF #ENJ #ZIL #APT #GALA #STEEM #ONE #LINK #NTRN #COTI #RENDER #ICX #IMX #ALICE #PYR #PORTAL #GRT #GMT # IDEX #NEAR #ICP #ETH #QTUM ***
