
shortBearish diverguence H4 is in an important reciaticism and is being generated a distribution zone therefore minimum risk short
RAYSOL/USDTKey Level Zone: 2.1600 - 2.1780
HMT v8.1 detected. The setup looks promising, supported by a previous upward/downward trend with increasing volume and momentum, presenting an excellent reward-to-risk opportunity.
HMT (High Momentum Trending):
HMT is based on trend, momentum, volume, and market str

#RAY Double Top Bearish Structure📊#RAY Double Top Bearish Structure 📉
🧠From a structural perspective, the goals of the bullish structure have all been achieved, and the target area overlaps with the blue resistance area, and we have built a bearish double top structure in the overlapping resistance area, so we are likely to enter

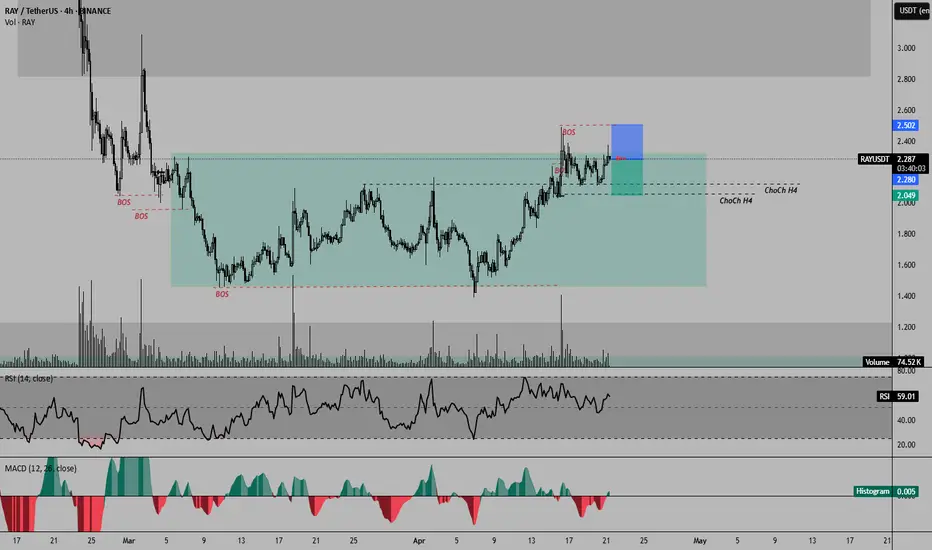
RAYSOL/USDT – READY TO BLAST OFF? PRIME LONG SETUPThis is where smart money is likely to reaccumulate before pushing price higher.
We're targeting internal liquidity levels and prior highs with a clean risk-reward structure.
Confirmation can come from a bullish reaction or engulfing candle within the zone.
Entry Zone: 2.25 – 2.28
Targets:
TP1: 2

Raydium support zonesRay is currently moving up longer-term. A trade could be caught on the zones shown


Breaks Out of Red Resistance Zone 🚨 NASDAQ:RAY
Breaks Out of Red Resistance Zone 🚨
NASDAQ:RAY
has successfully broken out of the red resistance zone, which was part of a symmetrical pattern. This breakout could signal a strong bullish move.
📈 Technical Overview:
Pattern: Symmetrical
Breakout Level: Red resistance zon

RAYUSDTLONG SET UP RAYDIUM 📈
market optimistic to going up to reach resistance (orange line)
please manage risk your self max5% no over Leverage cause this mid/long trade (swing trade).
support :
1.strong trend price above MA50
2.Initial break (engulfing 4H)
3.Dominan break 4H
4.stop loss support bello

long $RAY Radium broke through the resistance level and the descending trendline. The bullish movement to $3.09 is expected to happen

See all ideas
Summarizing what the indicators are suggesting.
Oscillators
Neutral
SellBuy
Strong sellStrong buy
Strong sellSellNeutralBuyStrong buy
Oscillators
Neutral
SellBuy
Strong sellStrong buy
Strong sellSellNeutralBuyStrong buy
Summary
Neutral
SellBuy
Strong sellStrong buy
Strong sellSellNeutralBuyStrong buy
Summary
Neutral
SellBuy
Strong sellStrong buy
Strong sellSellNeutralBuyStrong buy
Summary
Neutral
SellBuy
Strong sellStrong buy
Strong sellSellNeutralBuyStrong buy
Moving Averages
Neutral
SellBuy
Strong sellStrong buy
Strong sellSellNeutralBuyStrong buy
Moving Averages
Neutral
SellBuy
Strong sellStrong buy
Strong sellSellNeutralBuyStrong buy
Displays a symbol's price movements over previous years to identify recurring trends.