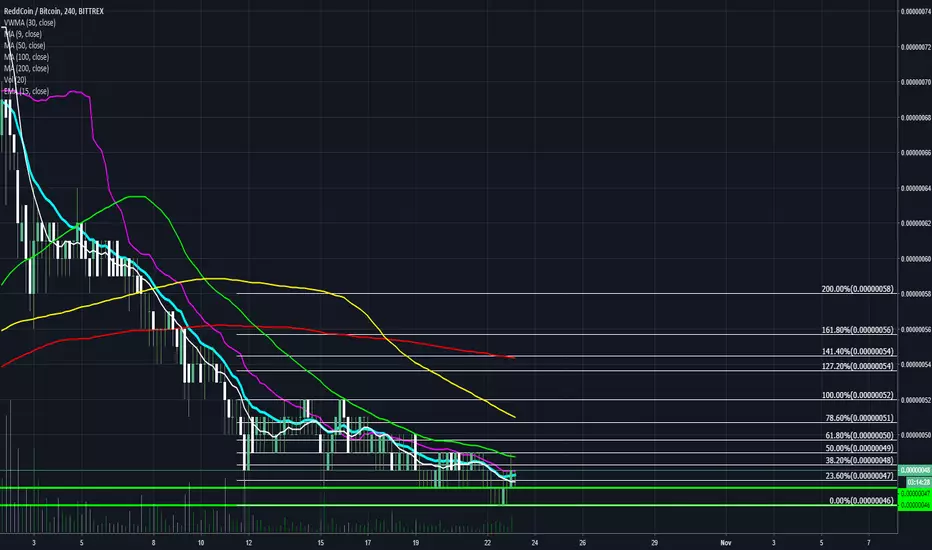
REDDCOIN PUMP I seen this Do crazy Spikes. PUMP & DUMP. You can get greeky or go exit early. Crazy Spike hourly spikes. I believe it might be a great buy zone on neon and it looks like a weak Cup and Handle. That may Cross us over downtrend line. 63 Sats looks rough but easy if the bulls are manipulating. 45 seen safe and a great gain. Be careful being stuck
RDDBTC trade ideas

RDDBTC opportunity 150-350% Profit targetLooking at market structures on RDD it shows the coin breakthrough from its falling wedge pattern with potential Double bottom formed at a good significant level.
Kindly follow the suggested accumulation zone on the chart and always remember to apply stop loss.
BLUE: POSSIBLE ENTRY ZONE
GREEN: SELL TARGETS
Do know that I appreciate you taking the time to read my posts and Please leave a LIKE and FOLLOW us for more updates.
Thank you
Note:
It will be good to always understand risk involve in trading. Always trade with stop Loss in place.
Set up an entry/exit strategy for every trade, with good risk/reward ratio.

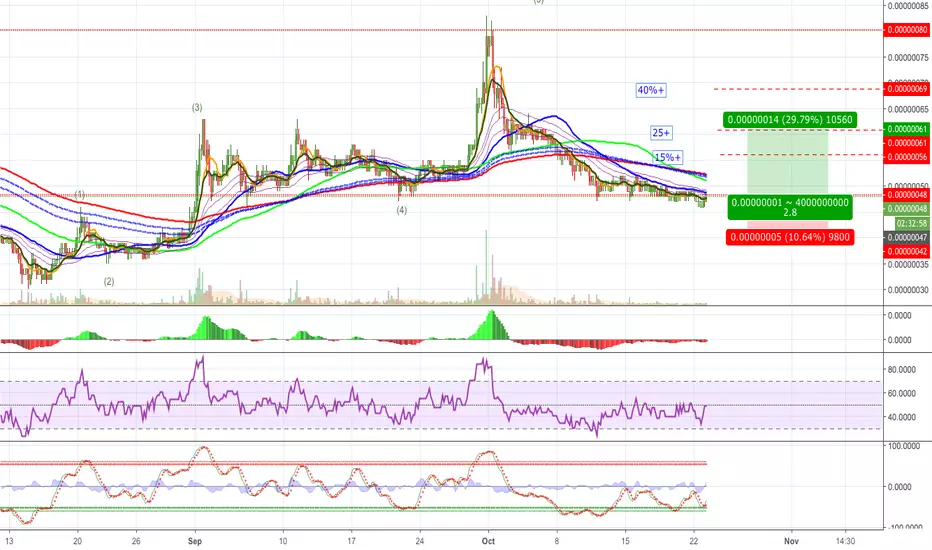
ReddCoin Gives A Strong Breakout[RDDBTC](515% PP)ReddCoin (RDDBTC) finally prints a strong breakout... I will say this before even starting; RDDBTC will generate massive gains in 2019... So hit LIKE so that we can continue...
ReddCoin (RDDBTC) daily chart analysis
The chart above is pretty classic for a cryptocurrency that has been on a bear market for long. We see long terms of bear action, followed by short but strong waves up.
These waves up can last several weeks to a few months. You can see them above marked with green on the chart.
Right now we have a very strong breakout, great volume, which moved RDDBTC price above EMA50 and EMA100, and reached all the way to EMA200 (MA200) where it found resistance and retraced.
The RSI is super bullish, in fact, already reached overbought, so you can expect a retrace.
The MACD printed bullish divergence for long, there is also a bullish crossover and it is now on the bullish side.
RDDBTC will generate great profits. 365% Profits Potential (PP) to January's 2018 top price and over 500% to a new ATH.
Hit LIKE TO SHOW YOUR SUPPORT.
Buy in, targets, stop loss and trade details below.
Trade instructions for ReddCoin on Bittrex
Buy in: Up to 44
Targets for RDDBTC by Alan Masters:
(2) 54
(3) 64
(4) 86
(5) 102
(6) 122
Long
(1) 157
(2) 179
(3) 196 (All time high)
(4) 271 (new high)
Stop loss: Close weekly below 28.
I AM LOOKING TO MAKE MONEY
Money is not only about money if about accumulating money you want to talk.
Money has many aspects, to get money you have to get your mind and body involved.
It is not only work, it is not only opportunity and luck.
It is about your mentality, your health, your desires, your wisdom and what in this life you really want.
So if you are looking to make money first focus on what the money will bring to you once it is yours.
Will this money bring happiness, freedom or allow for a change of environment or clothes?
Understand the meaning of money, to you, use that understanding to attract the feelings that you really want.
Once you know your true desires and decide that money can help you in seeking what you are...
Now you can start working for money, asking for money, attracting money...
Because deep down, you know that it isn't money... You are aware of what you really want.
In some cases it might simply be the material things that money can purchase, but in the majority of the cases people will be looking for freedom, security, peace, tranquility, happiness and all the beautiful things that we have experienced from the first day that we were born.
Yes I am looking to make money, but money is only a tool... A tool that can be acquired with patience...
PATIENCE IS THE KEY TO IT ALL!
Namaste.


RDD is moving UP sooner than you think! Over 50% potencialConsolidation of prize is over and now it is time to move up.

RDD; oh shit(coin)!!! 200% PPThe price is ready to join the movement of the oscillator (end of the divergence).
Entry: 32. If the rectangle is broken entry at 36.
Targets:
1st: 56
2nd: 63
3rd: 70
4th:76
final: 102


RDD/BTC ready or not readylong term projectation ( considering entering on a botton lini mid 2019)
starting bull market if we pressure down this next 60days on btc and pushed down.

BTC-RDD ReddCoin - Alt Coin Analysis - Point SystemAlt Coin Analysis - Points out of 10
Date : Since 2014 ( 8 / 10 )
Volume 24 H : 86.56 B ( 3 / 10 )
Available Markets* ( 5 / 10 )
Social Media Rate ( 4 / 10 )
Ranks ** - 66 ( 8 / 10 )
Website ( 3 / 10 )
Type Social media tipping
Overall ( 5 /10 )
At 20-38 satoshi? Great Risk & Reward. I personally really like Redd Coin Project. Remember June 2017 pump like it was yesterday :) I will buy A LOT If I catch around 20 satoshi again!
Sell target should be ....... with a next bull run! Just HODL
* Considering top 10 crypto exchanges
** Top 100 coins on coin market cap get 10 points

Rdd/BtcRdd/Btc still looks like it might go to the 12 sat area if this 30 sat area doesnt hold. Looks to Me that this 30 sats are might not hold. Protect your crypto and dont rush into anything.
------If you have any coins that you would like Me to check out just leave a message and I would be more than happy to check them out for you------
------If My charts have helped you and you are feeling generous-tips welcomed :) thanks------
Btc- 1HrzkkMTJZHvLxgutmNT9qNAussZwSBrf8
Ltc- LNhiQ2uEjUhy8UwmXUk1sgA9ZSXqSBkKRV
Eth- 0x85a2db972B76b8d8eAB52F77aB499CD5F74eDfaF
Bch- qr44ltflnphqprc34lmg9nz5zcr6dy0wdcqvx3q9u8
Iota-XTFHKGXUVPTQXFKLWDILPIYASLUIMK9GIJOGXACLEIPIOJI9LVYPGWDYCREXZCEYZ9MZLJJXPYDMRWWTYOYRKBZCCW

RDD rangingYesterday, RDD hit his august 14 level in a quite symetrical move, ending its V-wave formation. Now it is moving up, probably forming an I-wave to hit the top of the rectangle.

I cannot see RDD doing well for a whileThe launch of #ReddID was a bit of a flop and the market is not being fooled by it all.
The price of RDD is probably going to keep going down for a while... until the next pump.
- RSI is also not very good, (neither up not down)
- MACD is very flat, showing that only the holders remain .... (the volume is also low).
Maybe in the new year, if/when ReddID fulfils its +4 years old promises.

Bounce on trendline?Good time to load up some RDD. If everything goes well, Redcoin will bounce on the trendline to make us some nice profits.

REDDCOIN/BTCPodemos ver una tendencia bajista, con posibles subidas cortas en temporalidad de 1 hora.

RDD/BTC Idea I see RDD go around 41-42 satoshi with a bullish cypher pattern.
ENTRY ZONE: 40-42 Sats
SELL TARGETS:
TARGET 1: 47-50 sats
TARGET 2: 63-66 sats
TARGET 3: 80-83 sats
After the third sell zone a bearish Gartley pattern may be formed with the target 20-18 sats

43 SatsI was looking at the 43 sat line on cryptopia for a bounce, and its bounced to 51. This chart is Bittrex and it didn't hit the 43 mark, but we'll see if this can continue as a reversal for RDD. I'm bullish at these levels.

$RDD ReddCoin - Bottom is in, time for a rally!$RDD ReddCoin
CMC: coinmarketcap.com
CMCAL: coinmarketcal.com
Nice volume flowing in, may of found its bottom for now. Low sat coins are gucci for ez gains.
I'm acquiring at 47 to 48
My targets:
49
50
51
52
54
56
58
RDDBTC setupThis is my setup for RDDBTC. Took this trade, RDD is on edge (need to break RSI 50) and seat above MA50 on 4H. But R:R is too good to miss this opportunity.
There is a possibility for the beginning of an uptrend in RDDBTCTechnical analysis:
. REDDCOIN/BITCOIN is in a range bound and the beginning of uptrend is expected.
. The price is below the 21-Day WEMA which acts as a dynamic resistance.
. The RSI is at 40.
. The price downtrend in the daily chart is broken, so the probability of the resumption of an uptrend is increased.
Trading suggestion:
. There is a possibility of temporary retracement to suggested support zone (0.00000048 to 0.00000041). if so, traders can set orders based on Price Action and expect to reach short-term targets.
Beginning of entry zone (0.00000048)
Ending of entry zone (0.00000041)
Entry signal:
Signal to enter the market occurs when the price comes to " Buy zone " then forms one of the reversal patterns, whether " Bullish Engulfing ", " Hammer " or " Valley " in other words,
NO entry signal when the price comes to the zone BUT after any of the reversal patterns is formed in the zone.
To learn more about " Entry signal " and the special version of our " Price Action " strategy FOLLOW our lessons:
Take Profits:
TP1= @ 0.00000057
TP2= @ 0.00000062
TP3= @ 0.00000072
TP4= @ 0.00000081
TP5= @ 0.00000095
TP6= @ 0.00000113
TP7= @ 0.00000147
TP8= Free


There is a possibility for the beginning of an uptrend in RDDBTCTechnical analysis:
. REDDCOIN/BITCOIN is in a range bound and the beginning of uptrend is expected.
. The price is below the 21-Day WEMA which acts as a dynamic resistance.
. The RSI is at 43.
Trading suggestion:
. There is a possibility of temporary retracement to suggested support zone (0.00000047 to 0.00000041). if so, traders can set orders based on Price Action and expect to reach short-term targets.
Beginning of entry zone (0.00000047)
Ending of entry zone (0.00000041)
Entry signal:
Signal to enter the market occurs when the price comes to " Buy zone " then forms one of the reversal patterns, whether " Bullish Engulfing ", " Hammer " or " Valley " in other words,
NO entry signal when the price comes to the zone BUT after any of the reversal patterns is formed in the zone.
To learn more about " Entry signal " and the special version of our " Price Action " strategy FOLLOW our lessons:
Take Profits:
TP1= @ 0.00000057
TP2= @ 0.00000062
TP3= @ 0.00000072
TP4= @ 0.00000081
TP5= @ 0.00000095
TP6= @ 0.00000113
TP7= @ 0.00000147
TP8= Free
