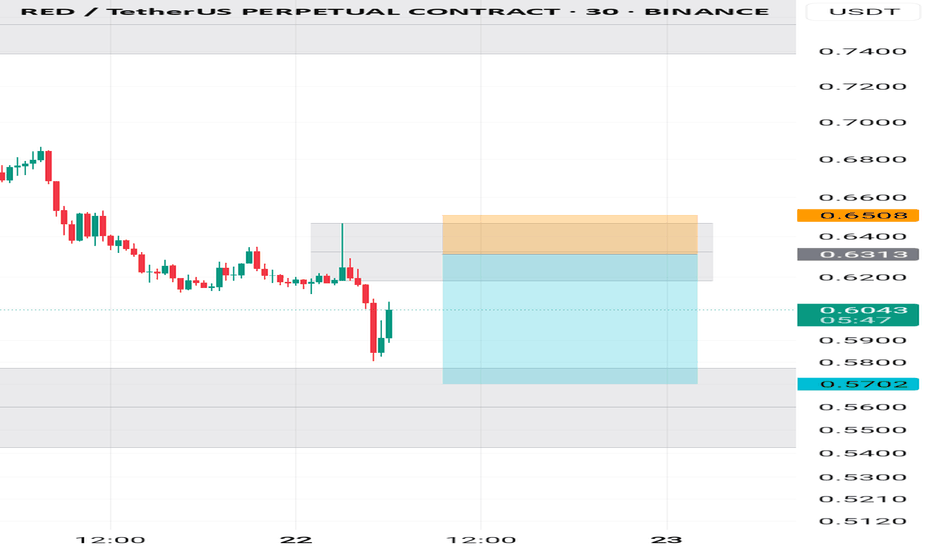
RED looks bearish (4H)From the point where we placed the red arrow on the chart, the RED correction has begun.
It seems to be inside an ABC structure, and we are currently in wave C, which is bearish.
A demand zone is visible on the chart, which could temporarily reject the price upward.
Since wave B did not retrace more than 0.618 of wave A, it is expected that the low of wave A will be taken out.
For risk management, please don't forget stop loss and capital management
Comment if you have any questions
Thank You
REDUSDT.P trade ideas
REDUSDT – Critical Resistance Zone! Read Carefully!Most traders LOSE MONEY because they act without a plan. They FOMO, they guess, they get liquidated. But we don’t trade like that.
Do you think I just take the first supply zone for shorts and first demand zone for longs ? It's not a mechanical process It has 3 main elements,
1- A coin/token with high volume increase, it means there are trading bots inside there and I can analyze their actions.
2- Volume footprint charts to see what levels trading bots are protecting, it's 3 step process with TPO charts and volume charts.
3- Coin Characteristics, all coins doesn't have similar characteristics, this is the perfect example of it. Please ANALYZE THIS!
As you can see we have double control points of very high volume bars in the red area. Other conditions are okey but I won't explain them because it will be too complicated. Today's lesson is this, thank you for listening.
🚨 Red Box = High-Risk Resistance Zone – This is where uninformed traders get trapped. But if you’re following me, you know better.
📌 The Smart Plan:
✅ Step 1: Wait for the price to reach the red box—no emotions, no impulsive trades.
✅ Step 2: Watch LTF structure + CDV shifts. If sellers step in and volume profile supports it, we execute.
✅ Step 3: If resistance holds, we short with precision. If it breaks with volume + retest, we flip bullish.
✅ Step 4: Risk is everything—trading isn’t gambling. The last swing high is the only stop that makes sense here.
📢 If you’re not following me, you’re trading blind. Stay ahead, trade smart, and watch how the market respects our levels.
RED New Update (4H)This analysis is an update of the analysis you see in the "Related publications" section
The previous analysis scenario has expired, and this update's scenario is valid.
Given the time correction of recent waves and the absence of sharp drops, this scenario for RED is valid, and buyers' footprints can be seen on the chart.
We expect a strong rejection to the upside from the green zone.
From the point where we placed the red arrow on the chart, it seems that RED's correction has started, which appears to be either a diametric or a triangle.
Wave C itself has formed a diametric, and it is expected to end in the green zone, leading to a bullish wave D.
The closure of a daily candle below the invalidation level will invalidate this analysis.
For risk management, please don't forget stop loss and capital management
When we reach the first target, save some profit and then change the stop to entry
Comment if you have any questions
Thank You
RED buy/long setup (4H)It is one of the new symbols with a bullish chart.
A bullish CH is present on the chart. A supply zone has been cleared. A strong demand zone is located at the bottom.
We are looking for buy/long positions in the demand zone.
Targets are marked on the chart.
A daily candle close below the invalidation level will invalidate this analysis
Do not enter the position without capital management and stop setting
Comment if you have any questions
thank you
#REDUSDT continues its downtrend📉 Short BYBIT:REDUSDT.P from $0,7814
🛡 Stop loss $0,8061
🕒 1H Timeframe
⚡️ Overview:
➡️ The main POC (Point of Control) is 0,5802
🎯 TP Targets:
💎 TP 1: $0,7600
💎 TP 2: $0,7330
💎 TP 3: $0,7112
📢 Monitor key levels before entering the trade!
BYBIT:REDUSDT.P continues its downtrend — watching for further movement!
Higher High & Key Resistance Test📊 BME:RED Market Update – Higher High & Key Resistance Test
📈 BME:RED has made a new Higher High (HH) and is now pulling back.
🔄 Current Scenario:
If price breaks the black resistance line, the next targets are at the blue line levels.
Price could return to the HH level, but the gap is located even higher, indicating potential further upside if momentum continues.
The gap area represents a previous strong selling zone, so traders should remain cautious when price approaches this level.
📌 Watch for breakout confirmation before targeting higher levels, and manage risk near resistance zones.
RED in Consolidation: Is a Breakout Around the Corner...?🚨 Current Market Update on RED 🚨
RED is currently consolidating between key levels:
💥 Resistance: 0.5925
💥 Support: 0.5670
We have two possible scenarios unfolding:
1️⃣ Bullish Breakout: If RED breaks through the resistance at 0.5925 and closes above it on the hourly chart, look for a potential long entry on the retest.
2️⃣ Bearish Breakdown: If RED breaks below 0.5670, we could see a sharp decline toward the next major support at 0.4000.
It's best to sit tight and enjoy your coffee ☕️ while we wait for a clear signal. 📊


