RENUUSDT RENUUSDT broke through consolidation with strong bullish impulse. Currently the instrument is facing resistance from 0.0893 region. If the price close above 0.0893, it will be the nice ride to upside with minimum gain of 13%.
RENUSDT.P trade ideas

Ren Getting ready for Massive recovery Seems Like Getting Ready For Massive bullish Wave Forming Falling Wedge In 3 days Tf incase Of Breakout expecting 350 to 400% bullish Wave


REN wants the breakoutREN already managed to breakout of the downtrend in lower TF.
With a confirm that would be a good entry point for a long position.

RENUSDTRENUSDT Technical analaysis update
Buy zone : Below $0.092000
Stop loss : $0.08500
Take Profit 1 : $0.11300
Take Profit 2 : $0.12500
Thanks
EZZ

Ren chartRen experimental data cluster chart. This in theory shows potential prices at a specific time. Once a square is hit it will reverse or continue to hit the next one. Usually once a square has ben hit the price will not get back to it until it hits a new one. This is done only for observation purposes, this is not financial advice

Ren chartRen chart.
This si done using an experimental method. These are the key levels for both bull and bear directions. Right now the price is in the middle

Renusdt Successful Breakout Renusdt
Breakout Was Already Confirmed & Retest Almost Done
Expecting 30-60% Bullish Move Soon
Dyor

REN/USDT
within 170 days expecting a breakout, red support line must hold, you can enter this trade now with a tight stop loss and sell into white line resistance, overall targeting the $0.28 mark

BUY RENBINANCE:RENUSDT.P
It has formed a trendline, buy with the expectation that it will break the trendline and we have a continuation buy signal.

RENUSDDT IdeaHi traders...
I'm sorry that I don't have time to write a full explanation...
I can only say that there is a high potential for the price to jump upwards, and Please, Tread this Trade Carefully
⚠️🚨 Risk warning, disclaimer: the above is a personal market judgment and analysis based on published information and historical chart data on The trading view,
And only some of these analyzes are my actual real trades.
I hope Traders consider I am Not responsible for your trades and investment decision.
✅ Please write any advice or suggestions.
Dear friends, request any cryptocurrency pair, currencies pair for forex, and any index that you want to be analyzed.

REN easy 200% in April to MayAccumulate $REN and thank me later.
$BTC Defi Narrative
Examples 👉 $STX $RIF already running
Ren is a dead project (fanbois don't shoot me) but doesn't mean it won't run too.

Ren Getting Ready For Massive Breakout Seems Like ren Has already Bottomed Out Formed Descending Channel In 2 days timeframe Incase Of breakout expecting 300 to 350% bullish move

REN position#REN update...
Get into a long position, with the possibility we deviate the lows... Looking at DXY, it can be up only...
NFA

Impressive Gain!REN is trading at $0.135000 and has gained the most compared to other assets in the market.
If we analyze the 4-hour timeframe, we can see that REN has been performing pretty well. The RSI is currently at 75, indicating that the asset may be overbought. However, the volume oscillator is at 26%, suggesting that there's still room for some price movement.
Additionally, the MACD is positive at 0.008520, which means that the asset is in an uptrend. The stochastic oscillator is currently sitting at 53.7, suggesting that the price is in a neutral zone and not oversold nor overbought.
Now, let's talk about some key support and resistance levels for REN. The Fibonacci retracement levels are always helpful for traders to identify potential levels of support and resistance. In this case, the 0.5 Fibonacci level at 0.099336 is acting as significant support, while the 1 Fibonacci level at 0.11448 may act as resistance.
Similarly, the upper Bollinger band at 0.131356 and the lower Bollinger band at 0.078257 are also crucial support and resistance levels, respectively. The middle Bollinger band at 0.104900 is currently acting as a support level as well.
Lastly, the 4-Hour EMA 50 at 0.101605 is also acting as a support level for REN.
So, what does all of this mean for traders? Based on the analysis, REN is currently in an uptrend, with potential support levels at the 0.5 Fibonacci level, the upper Bollinger band, the middle Bollinger band, and the 4-Hour EMA 50. However, the asset may face resistance at the 1 Fibonacci level and the lower Bollinger band.
Traders should also keep an eye on the RSI, as it is currently at 75 and may indicate an overbought market. All in all, REN seems to be performing well, and with the right strategy and analysis, traders can potentially benefit from its price movement.


Ren Getting Ready For Massive Breakout Seems Like Getting Ready For Massive Breakout
Testing Trendline In daily Timeframe Incase Of breakout Expecting 180 to 200% bullish Move

REN: INCREASE VIEWREn showing that it has the possibility to increase in the coming time.
we will follow it for the coming 24H

RENUSDTHello Crypto Lovers,
Mars Signals team wishes you high profits.
This is a 4-hour-time frame analysis for RENUSDT
R2, R3, and R1 on the top of this chart are our resistance areas that include the disability of the price to rise. And we have S1 and S2 which are our support areas; containing the support of price at various points. At the moment, we see the price was supported at S1 and it is fluctuating in a kind of rising trend below R1 line area. We believe there are two scenarios. Either a rise would take place for the price to touch R2 after breaking R1 upward. This will happen through providing us some rising signs and a fixation above this area and more increase will take place toward R2. But by the time the price lose the support and is rejected at any points especially at R1, it faces a decline down to our support areas. Bear in mind that you should check everything before putting your trade orders and then wait for a proper time to have your next action. We recommend you to active your stop-loss for experiencing more logical trades due to the unstable situation of the market. If you are looking for wise trades and less risky ones, our suggestion will be following our regular updates all the time.
Warning: This is just a suggestion and we do not guarantee profits. We advise you to analyze the chart before opening any positions.
Wish you luck


REN - Potential LONGS - 1Hr - BINGX: RENUSDTPERP Trade Status: ACTIVE
Trader: Drizzzled (AUS)
Trade Type: LONG
(RE-ENTRY/DCA/LADDER previous entry post
Entry 1: 0.09834,0.09667, 0.09497(or any of entry 1 zone options)
-if missed focus on next entries. Don’t stress.
Entry 2: 0.08980 “”
Entry 3: 0.07996 “”
Entry 4: 0.07484 or 0.07327 “”
Entry 5: “”
Entry 6: “”
Entry 7:
Stop Loss/ladder re-entries:
Entry 1: 0.08826 or slightly above/below (resistance/support)
-slightly below your re-entries
-5-10% (depending how big the coins range is) move from your chosen entry 1
-slightly above/below entry/key resistance
-1:1 or to own personal risk factor
Entry 2: 0.08826 “”
Entry 3: 0.06922 “”
Entrt 4: 0.06922 “”
Take Profit Targets:
- 0.10240
- 0.11540
-
-
-
Comments:
-move stop loss to break even once target 1 is hit. DCA entries above/below if stop loss is hit.
-emas will rise/drop with time so shift tp accordingly. If we re-enter higher/lower our same emas become our take profits. Also i have put boxes around key supports which I may choose to take earlier or later profits at too.
-by all means you can long from the daily open to these higher target ‘short’ entries.
-you don’t have to enter at ‘entry 1’ if you would rather enter higher.
-level 1,2 or 3 ,pumps/moves, can go higher and create new levels, hence the re-entries. It’s a shorter time frame strategy.
-the harmonic targets are the take profits of the opposite trade to ours so it’s our res/support to enter at.
-don’t hesitate to dm me for guidance :)
@everyone
-Read the write up hit me up if need help.
-treat every entry or entry zone as a single trade setup with its stop loss. If that entry fails we move onto the next entry and so on. Don’t get confused by all the entries take one at a time exactly as every other signal provider does. I’m just giving you the whole range as price action or market makers don’t just retrace at one conventional support/resistance. We are just building confluence lines then grouping them into a stronger chance entry.
The DCA/Ladder technique is for the advanced traders. If your new don’t stress about that for now.
-Entries
-zone equals anywhere in that area and entry only means as close to that entry as possible.
-each stop loss is numbered corresponding with the entry below.
-note each liquidity pool (left boxes) could get taken then retrace.
-note there are bigger fibs above so maybe aim for lower time frame take profits aka 5/15/1hr 50ema.
-arrow pointing up on the take profit zone box means that emas will rise so take profits will rise.
-emas to have on the chart are
5ema (light blue)
13ema (purple)
50ema (yellow)
200ema (red)
800emas (green)
-there are an many liquidity pools to the low to recover which worries me for high prices so stay vigilant.
I hope that helps ;).

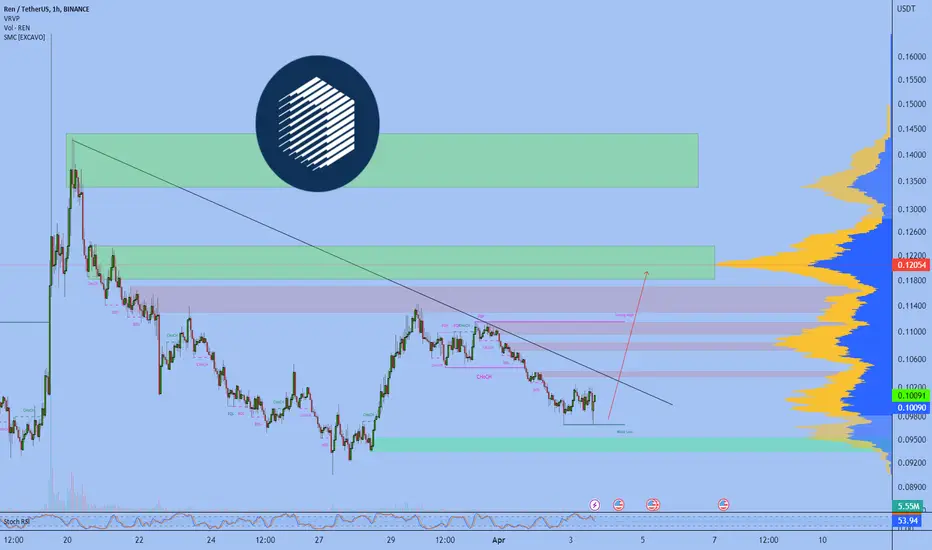
RLinda ! RENUSDT-> Will there be a resistance breakthrough? RENUSDT against the background of the correcting cryptocurrency market looks quite confident and, presumably, is preparing to break through resistance
The price forms the third retest in a row against the descending resistance line, forming a bearish wedge. A pattern that can form a strong bullish impulse in the medium term and even change the trend.
There is a high probability of price exiting the range (consolidation) and further growth.
In the medium term I expect breakthrough of resistance and consolidation of the price above the level of 0.1212 with further bullish impulse formation to 0.2000, 0.246, and in the long term to 0.4226.
Regards R. Linda!
