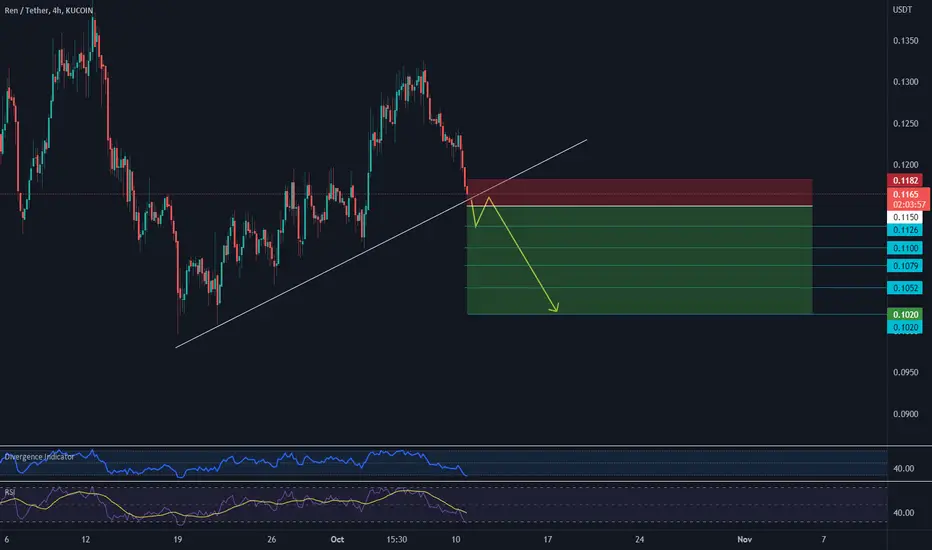
REN SCALP SHORT SETUPI think a Scaply short can be extracted from the chart of this symbol. My setup is like this.
RENUSDT.P trade ideas

REN/USDT Short...REN/USDT Sell.... This is not signal... Dont risk more than 3% of your account on any trade...
REN/USDTren usdt
looking bullish
rsi divergence
ascending triangle
long entry
trend analysis
harmonic
indicator

ALGORITHMIC DATA SHOWS REN CAN BREAKOUT 70%OUR ALGORITHMIC DATA shows that REN can break out 70% coming time or more.
This depends on last trends in data.
We will follow and see how this trend will play out coming time.
REN is on an important level also in the 4H range.
It's THE NO 1 coin with 100% CC SUPPLY.
This means there are not more adding of coins. ( price stable) and more high chance for a long-term increase trend.
This is our ALGORITMIC trend view, but its adding with more adds/settings when we use it.

REN/USDTREN/USDT
After resuming an upward trend, in my opinion, it can increase the price up to the ceiling of the channel and the area of 17 cents.
#REN #RENUSDT #BTC #BTCUSD #LUNA #LUNC #UST

REN : Interesting for day tradingREN: Interesting for day trading
Its the moment coin, and open to check, or there are some entries
Like and follow for more updates as this❤️
The coins that add to the channel have a high chance to trend.

REN : DAY TRADE VOLUMERen day trading volume increasing.
we will see if this will have some effect on price action coming time.
Small time frame - just for day trader in case volume increase more

RENUSDT - Long with Price action & Volume Spike 10/2/2022- Higher High, Higher Low with higher Volume.
- Correction wave with a weak volume.
- Bull candle with strong volume > 4xMA(20).

Flag Chart Pattern DefinationThe flag pattern is encompassed by two parallel lines. These lines can be either flat or pointed in the opposite direction of the primary market trend. The pole is then formed by a line which represents the primary trend in the market. The pattern, which could be bullish or bearish, is seen as the market potentially just taking a "breather" after a big move before continuing its primary trend. The chart below illustrates a bull flag. A bear flag would trend in the opposite direction.

REN/USDTREN/USDT
It is located in a descending channel. I think it can fall to the bottom of the channel once more and then grow from there to the top of the channel.
#REN #RENUSDT #BTC #BTCUSD #LUNA #LUNC #UST


ren about to drop into its accumulation zonewe got rejected from the midrange yesterday. on our way to range low since the cpi numbers were made public. I expect btc and eth in general to roll over, at which point ren will follow suit.
accumulation for next bullrun will take place from 0.048 to 0.035$ range
lets see what happens

Ren bullishI like the bull market this is a bullish butterfly pattern on the weekly time frame it looks like the correction is over and we are ready to move up

#REN longHello dear Traders,
Here is my idea for #REN
Price finds support at monthly pivot S1 line.
Price closed on daily chart above the yellow trigger line (previous month high) .
Targets marked in the chart (black lines)
Invalidation level marked with red line
Please feel free to ask any question in comments. I will try to answer all! Thank you

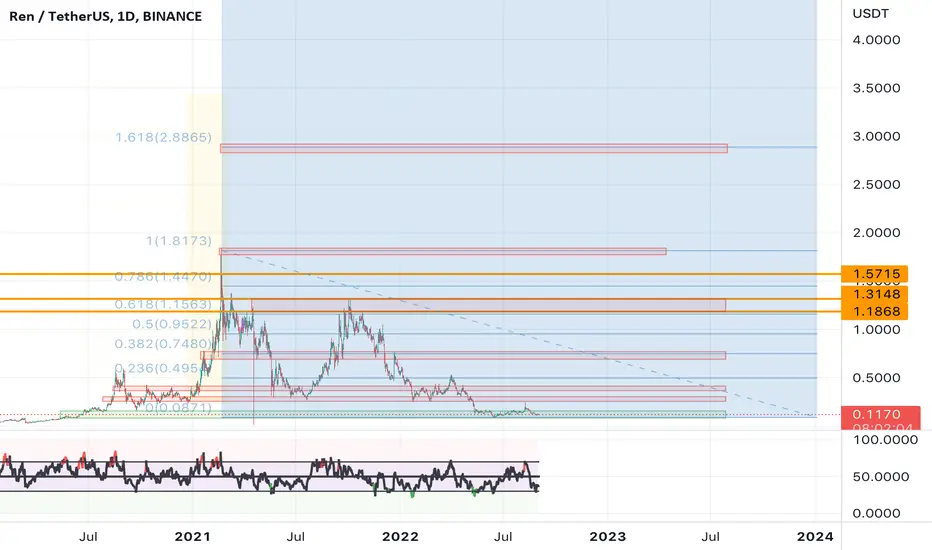
REN future price prediction versus Fibonacci levelsSo it's just a prediction but this is the way I use fib levels, for high and low. Questions are welcome.
Long for a very long time :)
REN/USDT BUYING SETUP (SWING)#REN/USDT BUYING SETUP (Swing)
$REN Retesting resistance become support after breakout Inverted HNS Bullish pattern . Daily close before is Doji candle if REN next candle with Green candle potential continue upward movement . Buy with money management
Entry : 0.1657 - 0.15 - 0.135
Target : 0.1864 - 0.2119 - 0.2420 - 0.2751 - 0.3098
Stop : 0.125

BUY REN▶️RENUSDT
❇️Buy 0.163
📈Targets📈
🎯TP1 : 0.21
🎯TP2 : 0.26
🛑 STOP LOSSE 🛑
4h Candle closing under 0.118
Share your opinion in the comments and support the idea with Like.
Follow me on tradingView, if you don't want to miss my next analysis or signals.
Thanks for your support!

REN, breaking through and pumping up.The following are machine translations:
On the daily chart, the previous head-and-shoulders bottom pattern broke through the neckline and made a high, and now steps back on the neckline to get support and rebound.
Indicator macd bullish trend, RSI indicator reached near overbought.
Summary: Stepping back and rebounding and the indicators are bullish, it is expected that the fairy will guide the way, with a target of 0.22.

REN/USDT possible scenario!Hey Traders,
We are here back with REN/USDT. Re-buying this coin here at $0.148. We won't talk much so Take profits are next: $0.165-$0.20-$0.26-$0.31
We would take out the trade if the daily candle closes below $0.10
If you like ideas provided by our team you can show us your support by liking and commenting.
Yours Sincerely,
Swallow Team 🔱
Disclamer:
We are not financial advisors. The content that we share on this website are for educational purposes and are our own personal opinions.

RENUSDT | SETUPRENUSDT after taking a beat from resistance approaching to rising support. The price can took support from rising trendline. We are expecting a pull back from support towards falling resistance.
The bulls need to maintain price above rising support. While below the support all over for bulls.
Manage your trades accordingly.

Long REN on a clear break of 16 cent region1. 16 cent region has been clear resistance to the upside during the bear.
2. Little resistance above that until the 25-30 cent region.
3. Fundementals look strong on the asset which earns a decent APY without any token inflation, also keep an eye on ZeroDAO, Catalogfi and VarenX which are all building upon the REN protocol technology.
4. Plans to launch their own L1 to provide seemless crosschain liquidity and crosschain dapps in Q4.

REN, head and shoulders bottom pattern.The following content is machine translation:
On the daily chart, the REN daily pattern structure is expected to go to the head and shoulders bottom, and now the right shoulder is rising, bullish.
The indicator macd is in the retracement of the bullish trend and is about to cross. The RSI indicator is again above the neutral 50, in bullish territory.
Summary: Head and shoulders bottom pattern structure and bullish indicators continue to be bullish, target 0.165+

renusdt is bullish overall?renusdt is in a correction phase, seems like it will bounce back after hitting the trend line.
