XRP 2.0 or SC?! Easy long with triangle
Trade Idea: SC/USDT (Long)
Current Situation:
- The SC/USDT pair is showing signs of strength on the daily/hourly timeframe (choose the appropriate one).
- The price has bounced off a key support level, indicating a potential upward movement.
Key Levels:
- Support: 0.0050 USDT (a critical level holding the price).
- Resistance: 0.0070 USDT (the nearest target for take-profit).
-Next Target: 0.0085 USDT (in case of a breakout above the first resistance).
Technical Indicators:
- RSI (14): Currently in the oversold zone (below 30), suggesting a possible reversal upward.
- MACD: The MACD histogram is starting to shrink, indicating a potential bullish crossover.
-Moving Averages: The price is above the 50-period SMA, confirming an upward trend.
Trade Plan:
1. Entry Point: 0.0036 USDT (after confirming the bounce from the support level).
2. Stop-Loss: 0.0025 USDT (below the key support level to minimize losses).
3. Take-Profit:
- First Target: 0.1 USDT.
- Second Target: 0.8 USDT.
Risk Management:
- Risk per trade: No more than 2% of your deposit.
- Risk/Reward Ratio: 1:3 (high potential reward with minimal risk).
Fundamental Catalyst:
- The Siacoin (SC) project continues to develop, and decentralized data storage is gaining popularity. News about partnerships or protocol updates could act as a catalyst for growth.
Conclusion:
SC/USDT looks attractive for a long position, with a clear support level and potential to rise toward resistance. However, always monitor the market and be prepared for corrections.
SCPERP trade ideas

SC Siacoin Long-Term TA 2025-2026This one look bullish.
Big developments done since 2017 and the team releases around the corner...
The season of cheap coin low-satoshi coin and low-usd coin just at the beginning
There is a lot of chances fir SC to go X times Up anytime from now.
Check the Chart and be ready to big moves...
Enjoy!

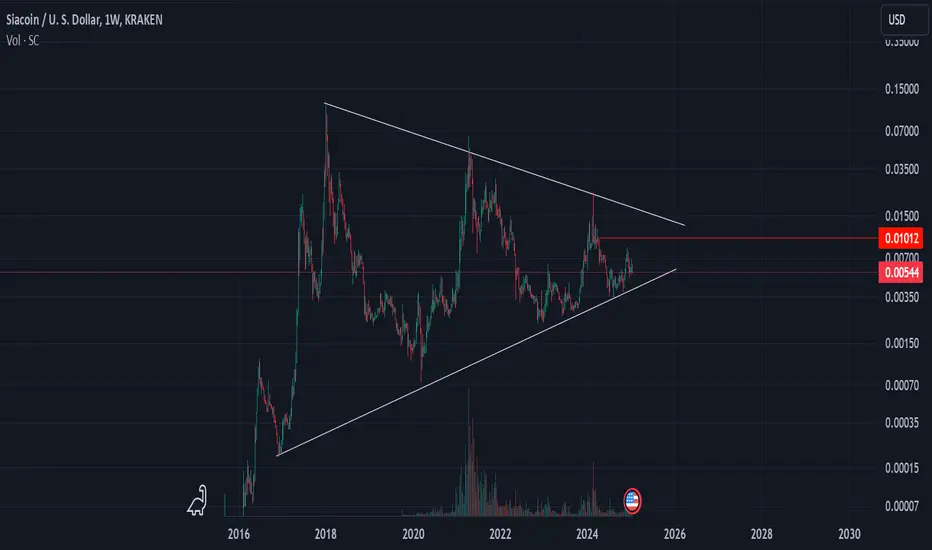
Siacoin UpdateSC has been forming a triangle since 2018.
Breaking $0.0025 invalidates the idea
Passing $0.0230 should confirm targeting a new ATH.
#Siacoin

SC One of Most Legendary AltcoinSC aka Sia Coin is one of most legendary alt coin and still exist
You can see in big timeframe on log chart is like someone created triangle and this pattern has been created after bullish from 2015
SImple guys, if weekly close above .1 maybe insane movement will happen
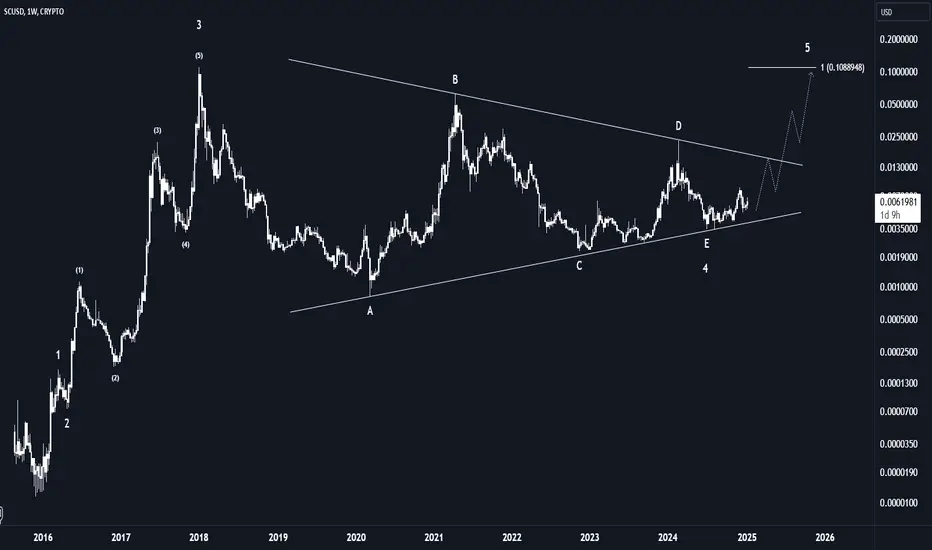
SC/USDTI recommend this currency for holding. Super wave 4 has completed in the Elliott triangle. For wave 5, it has the potential to increase 15 times.
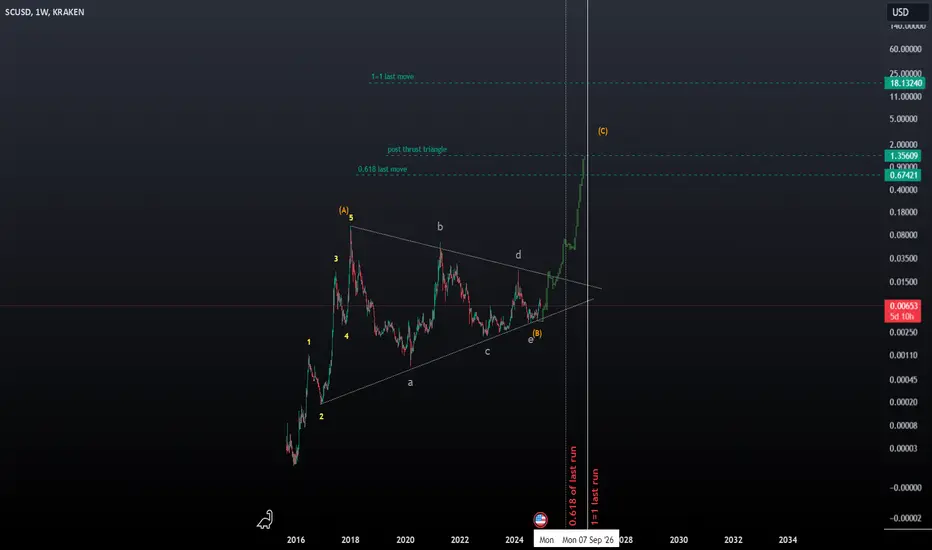
SIACOIN - SCUSD This is one of my most favorite coins.
In terms of risk-reward ratio this looks amazing, your looking at potentially 100x targets.
Siacoin my biggest bag8 year pennant, SiaV2 launching before end of the year could give it the momentum it needs to breakout. It seems crazy but a measured move would put this at over $1.00. Chart really reminds me of Doge back in the day.


Siacoin (SC)Siacoin is one of the first pioneers in the field of blockchain-based distributed decentralized cloud storage platforms. Sia acts as a secure, trustless marketplace for cloud storage in which users can lease access to their unused storage space. As can be seen, in the past, SC has grown a lot. SC has been oscillating in a huge triangle pattern. Recently, it seems SC has started an upward wave; could this wave be the one that breaks the huge triangle pattern upward? Let's see what happens.

`Siacoin gained momentum and will soon rally againWe see the same pattern again and again; ready to rally again.

SCUSDTWith the formation of double bottoms
and the breaking of the downward trend in the weekly chart
It can be as low as 0.00387
and considered the first target of 0.00809

Shark CatProbably shark cat bottomed here against solana, invalidation of bull case is closing daily below 205, besides that all is good.

22X -- SC coin back up to ATH break out of triangleBullish case, 22 x from about 0.0005 to 0.11 so say 20x
break out and hold from triangle
Crypto Sia coin
few years time wish I had bought more - note to future self ;-)))
Why not - just do it !
buy and forget if you are bullish and see you in end of 2025!
Multi year crypto triangle
I bet it over performs the conservative targets if we get an ALT bull market
Generally triangles will exceed their tops of the triangle pattern if so then this is a really big opportunity for all who take it. You could use the money to buy new house, holidays, new car, just stay in the trade, take 80% at target and let the rest run. Or reassess nearer the time dependant on how it travels to target, straight up breakout leave it on and wait for consolidation, or pivot into new trade ?

Siacoin analysisI could be wrong but this could be the truth.
If you believe that it will rise very soon, it is normal.

SIACOIN ALL TIME CHARTAfter embedding the all time chart of Siacoin from CoinMarketCap, I believe that the coin has been in a triangle since 2018.
Most of the classic coins have the same view or similar that they're in historical triangles.
I believe BMV:SC should find it's way to a new all time high within the next few years.

We are still inAs long as we don`t break the triangle downwards, it all looks very promising for some nice upwards moves

Very Crucial Point For Sia CoinThe coin of this fantastic cloud storage marketplace, will test its strength during the next few days. It is very strange that this successful project has not yet earned the gains it deserves. If it was a stock, I'd say it's undervalued.

Siacoin is one of my favoritesI believe that by the end of the year or sooner, we will have reached 100%, which will be the start of a big climb

SiaCoin actin like it wants to trigger an invh&s breakoutIf it validates the breakout on the current breach of the neckline the measured move target is about 2 and a half cents. Nice to see SiaCoin actually doing something for once, been a long while. Must be a true tell sign the bull market is back. *not financial advice*

Siacoin : One simple clean chart can show more than 1000 words..While we are bouncing between support and resistance, sia is looking strong on the bigger time frames.
Supp. and res. lines are getting closer towards each other,in a symmetrical triangle.
price is also making a sort of inverted head and shoulders pattern between those support and resistance lines.
For now it looks like, everytime the rsi crossed 70 , we get a quick and strong price movement.
If we break , and retest the 0.02 resistance area as our new support,
the higher pricetargets , around 0.30 cents are coming into play.
correct me if i'm wrong , but if bitcoin stays bullish , this is what we are looking at on the monthly chart..
i also overlayed the 2016 - 2021 bars pattern , to show what sia's price did in the past.
After that, i stretched the blue bars pattern out just a little , to account for the exponantional growth of the whole crypto industry.
off course there also should be a fib , and some moving averages, but i wanted to keep the chart as clean as possible, to show the expected price action most clearly.
as always ,
-always use a stoploss
-never trade without charting first
-never invest any money you cannot afford to lose !
-my charts are not financial or investment advise
-my warnings are.

Siacoin nearing possible top, indicators show we've had timeI've been accumulating this coin for about a little more than a year now, dollar cost averaging and buying when things are quiet seem to have paid off. Letting go of my bags as we near 0.02, risk is on after that.

SCUSDWe expect price increament to 0.02 after which a likely reversal to 0.014 where we can re-enter the market once more. There is a 80% chance our price prediction for the year will play out for scusd

SCUSDBULLS ARE BACK. We are expecting an increament in all altcoins as bitcoin rises. Siacoin has a great fundamentals for this bullish run in period
