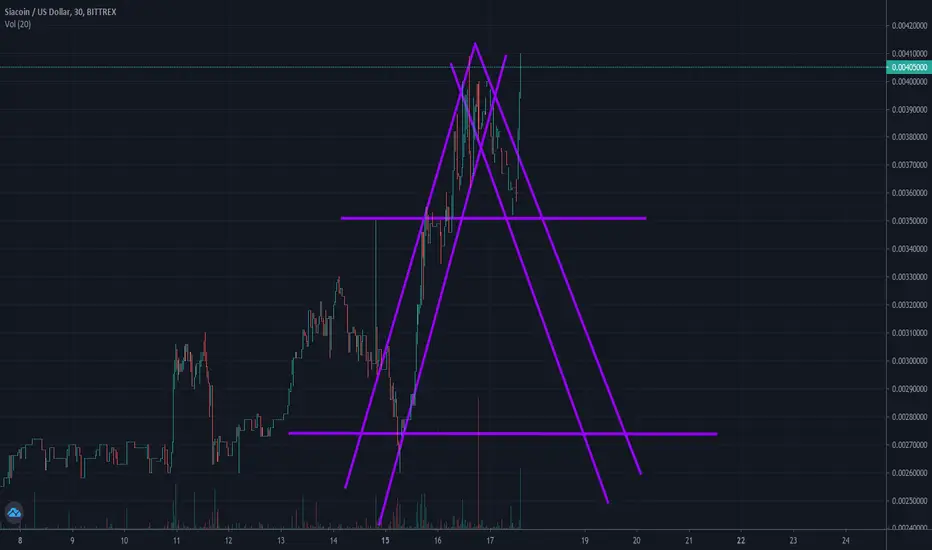
Ascending Trianle (Short term 150% profit potential)5 reasons to go long on SC.
A very clear ascending triangle pattern which can potentially help SC to break through a long term resistance line (denoted with the hammers).
An ascending triangle is a bullish continuation patters and the fact that the price is hitting the supply line (diagonal line of the triangle) means that the perfect entry might be right here.
Volume is diminishing when the price crawls closer to the end of the triangle, but can gain very quickly in a bullish market.
In a bull cycle money will flow from BTC to top 10 altcoins (been there (ETH, XRP, LTC etc.), then to mid-top altcoins (next/now) then low marketcap altcoins (thereafter).
Once it breaks out of the triangle there is lots room for growth.
Please, let me know in the comments what you think of the idea and check my very early prediction for breaking the long term resistance line of BTC as well and follow me if you go long for updates.
SCPERP trade ideas


scusd day analysisVirtual money has high profits and high RISK. THIS IS NOT AN INVESTMENT PROPOSAL. My personal opinion.
If you find this useful and want more FREE guesses.
Please show your support.
Press the Like button.
Leave your feedback to us in the comments section!
Thank you very much for your support.
Let us know how you see this opportunity and forecast in the comments.
Abundant earnings


Siacoin USD may have just hit rock bottom... Moon time bois ...?So basically, the Divergence indicator by Julioc96 is showing a nice bullish divergence arrow on the weekly chart.
Take a look at the BLX weekly chart for the same chart pattern during the 2014-1016 bear run.
This is not financial advice... You're an idiot if you think it is.

Even with Bullish Divergence, SCUSD should drop to $0.00 becauseEven with major Bullish Divergence, SCUSD should drop to $0.00 because buying crypto always seems to do the very opposite of what I hoped for.
Basically, if you buy crypto like SiaCoin, expect the dollar value of your assets to vanish like a fart in the wind over the next couple of years.
This is not financial advice.
This chart is obviously a joke, just like you.


Wait another one wants to go 150% gain? Looks that waySo i got to run, it is kind of late, but i really wanted to do this.
So using fibs and trend lines, i see some juicy potential here.
Watch for a breakout!
Good Luck Everyone! Happy New Year, lets make Crypto Great AGAIN!!
**LEGENDS**
BLUE = Bear/Resistance
Yellow = Bull/ Support
Vertical Lines: Fractal dates are moments of interest, where price and time collide to create oscillation.
~Explore the chart for possible scenarios of price actions - use zoom and scroll for better view.~
/*This information is not a recommendation to buy or sell. It is to be used for educational purposes only.*/
Feel free to request: your coin to be analyzed! Please keep those Stop losses in place!
Thank you,
Please, follow, help me get to a 1000 followers :)

SCUSD BREAKOUT - LONG SET UP AND S/RBeautiful resistance trendline breakout with volume. Look how EMAs try to cross bullish. We have all the indicators on daily on the bullish side:
- MACD signal line crossing ZERO upwards.
- RSI over 50 after a long time. Now we look to RSI instead of stoch, because ADX is on trendy side.
- ADX DI+ is dominating in an bullish trendy way.
We have our green rectangle support area confluence of: EMA + Fibonacci level + S/R
We have our resistance red rectangle (ultimate target) confluence of: FIBONACCI + S/R + EW.
Not advice, It's just my journey! have a nice Sunday.


