Buying Spot CMP Target $1SEI
Sei
SEI
#71
207K
$0.3398
3.36% (1d)
Market cap
$1.5B
3.36%
Volume (24h)
$111.57M
19.92%
FDV
$3.39B
Vol/Mkt Cap (24h)
7.45%
Total supply
10B SEI
Max. supply
--
Circulating supply
4.43B SEI
SEIUSDT.PS trade ideas

#SEI/USDT Ready to launch upwards#SEI
The price is moving in a descending channel on the 1-hour frame and is adhering to it well and is heading to break it strongly upwards
We have a bounce from the lower limit of the descending channel, this support is at a price of 0.3000
We have a downtrend on the RSI indicator that is about to be broken, which supports the rise
We have a trend to stabilize above the moving average 100
Entry price 0.3040
First target 0.3200
Second target 0.3400
Third target 0.3617

$sei continue crash tomorrow $0.27NYSE:SEI is the next pair am planning to short along with bitcoin short that I took earlier, See most recent idea.
Target: $0.285 - $0.27 Just a matter of timing.
So NYSE:SEI and #btc only until either play out then I look for next setup. Just to keep correlation risk to a minimum.
NYSE:SEI looks very very very likely to fall to $0.2850. Prior month support is in that area.
Will update when I take my entry below

SEI/USDT Chart Analysis 1D#SEI/USDT is currently trading within a falling wedge formation on the 1 days timeframe, a classic bullish reversal pattern. This pattern, coupled with a liquidity sweep at the lower boundary, has already shaken out impatient traders. But remember, no move is confirmed until we see a decisive breakout. A decisive move above key resistance is needed to confirm the shift in momentum. If the trendline of the pattern breaks, we can prepare for a bullish trade and we can witness a strong upward movement.
Targets🎯
🎯 0.3717
🎯 0.45
🎯 0.5094
🎯 0.66
🎯 0.7369

#SEI Ready for a Bullish Rally or Not? Key Levels to Watch Yello, Paradisers! Is #SEIUSDT gearing up for a major breakout, or are we in for another leg down? Let’s break down the #SEI setup:
💎#SEI is currently trading within a falling wedge formation on the 8-hour timeframe, a classic bullish reversal pattern. This pattern, coupled with a liquidity sweep at the lower boundary, has already shaken out impatient traders. But remember, no move is confirmed until we see a decisive breakout. A decisive move above key resistance is needed to confirm the shift in momentum.
💎The major resistance zone to watch is $0.479. If #SEI manages to break above this level with strong volume, we could see a sharp rally towards the $0.65–$0.70 range, where significant selling pressure may come into play. However, failing to break above resistance could lead to another retest of lower levels before any bullish continuation.
💎On the downside, #SEI is sitting on a strong support zone around $0.2800. Buyers have consistently stepped in at this level, reinforcing its importance. If this support holds, we can expect a bounce and a potential attempt to break out of the wedge. The next line of defense for the #SEI is at the demand zone at $0.205 if the above support fails.
💎However, a candle closing below the demand zone at $0.2053 would invalidate the bullish scenario, exposing #SEI to a further drop towards $0.15 or even lower.
Stay focused, patient, and disciplined, Paradisers🥂
MyCryptoParadise
iFeel the success🌴

Sei long to $0.3456Just recently entered NYSE:SEI long
I anticipate that the market will push back up anytime now.
Its quite low on the daily tf and seller exhaustion is visible as bulls are starting to break back above resistance.
Looking to start scaling out at $0.3305 though at least 50% just incase strong supply comes back in the market there.
It seems to me its just a matter of good stop placement right now, I feel confident that it will play out.

SEI’s Comeback: Time to Ride the Wave to ATHs!Giving SEI a second chance—why?
It’s made a higher high and taken out the previous swing highs before the massive drop to 20c. That’s enough for me to start scaling back in.
I was a bit early before, buying at the same price in October, but now it’s looking much healthier.
I think this time it breaks ATHs. So, start jumping in to enjoy some nice gains!
BINANCE:SEIUSDT

high tf longi expect sei to do a liquidity grap below last higher low on the daily timeframe and that could be a really golden position for a big 3x up to 1$

SEI/USDT | 4-Hour Reversal SetupThis SEI/USDT 4-hour chart highlights a potential buy setup at a key demand zone:
Entry: $0.3160, anticipating a bounce from the current consolidation.
Stop-Loss: Placed at $0.2590, below the order block (OB) zone for risk management.
Take-Profit: Targeting the $0.3200-$0.3400 range for potential gains.
The highlighted OB zone reflects strong historical support, making this a high-reward trade with manageable risk. Confirmation from volume and candlestick patterns is recommended before entering the trade.

SEIUSDT 4DSEI ~ 4D Analysis
#SEI If you still have a Conviction on this Coin, buy gradually from here with a minimum target of 20%++

SEI LONG SEI is currently in a support zone at 0.25 and near the lower boundary of the descending channel. The price may continue to move within this descending channel until it reaches the 0.30–0.28$ range.A reaction is likely to occur from that zone where we have the nPOC and the 61.8 Fibonacci retracement level.

SEIUSDT 12H#SEI is moving within a falling wedge pattern on the 12H chart. Buy and hold. In case of a breakout, the targets are:
🎯 $0.4270
🎯 $0.4860
🎯 $0.5337
🎯 $0.5813
🎯 $0.6492
🎯 $0.7357

SeiusdtCosmos layer1
Long term bullish divergence highlighted in yellow
Falling wedge into support trend line
Macd bottoming out
When this falling wedge does break upwards the target is ~75% to the local high
Looks like potentially another small sweep before bouncing tbh as the macd has room below probably waits for the February monthly downwick (early in the month?) before bouncing

seu/usdtIf this high-potential zero is stabilized in the determined range and creates a diver sex in Makdi and returns to the upward cycle and forms 123 and creates a hidden diver sex in Makdi, it can be entered by ending and having confirmation and move towards the goal with basic capital management.


SEI BOUNCE FROM SUPPORTThe SEI weekly chart exhibits a textbook bounce from the key support level at 0.3304, which has held firm and demonstrated buyer interest in this zone. This bounce off support is a bullish signal, with price showing early signs of recovery.
The first target to the upside appears to be 0.4786, representing a key resistance level and potential inflection point for further price action. A sustained move above this resistance could open the door for SEI to test higher levels, with significant room for growth if bullish momentum continues.
Volume appears to support the bounce, suggesting that market participants are stepping in at this critical support level. Traders may look for follow-through confirmation this week to validate the strength of the move and track price action as it approaches resistance.
Easy invalidation below support for traders.

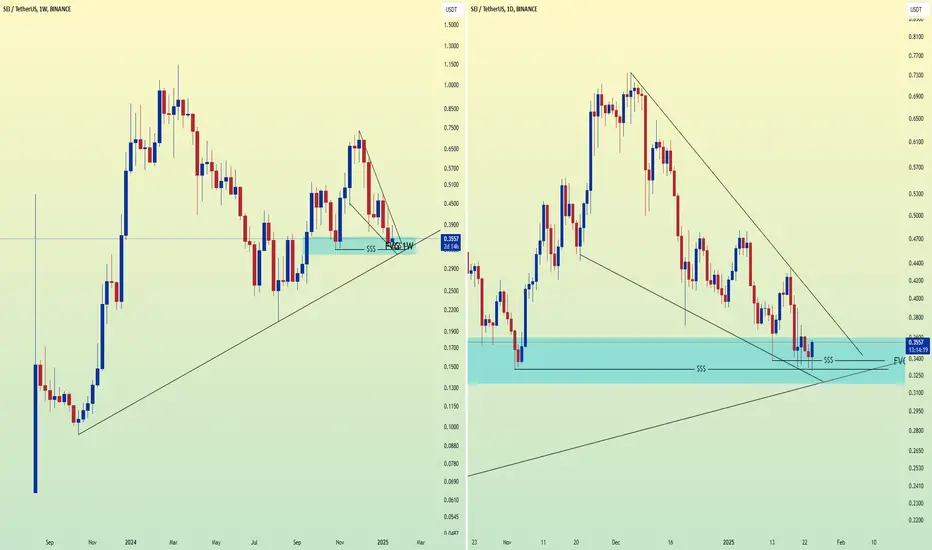
#SEI chartAmazing chart in weekly, 3D and daily chart. It looks like the liquidity is starting to build for the next big move.
There are two strong FVGs at this point that I suggest you check out.
SEI at strong supportTechnically, SEI is in a good area. Especially if this week's candle closes at bear

SeiUsdt Detailed Gann AnalysisHello dear friends,
chart provides a clear grid of Gann levels plotted against price and time. Here's a detailed interpretation based on the chart provided....
---Overview---
The current price is at 0.3403 USDT, slightly above the 108° (0.4094 USDT) level but below 144° (0.4943 USDT), suggesting the price is within a bearish zone and struggling to break upward resistance.
Time and Price Intersection:
Vertical green grid lines indicate key time cycles where price action may align with Gann levels for a significant move.
The next major cycle aligns around mid-2025, signaling a potential trend change or acceleration.
Diagonal Lines:
The diagonal grid acts as trend guidance. If the price follows the upward diagonals, it reflects bullish momentum. Breaking downward diagonals suggests a bearish trend.
---Trading Insights---
A. Bullish Scenario:
If the price breaks above 0.4943 USDT (144°), it is likely to target 0.5877 USDT (180°).
Sustained buying pressure beyond 0.5877 USDT could push the price toward 0.6882 USDT (216°) and higher.
B. Bearish Scenario:
Failure to hold 0.3324 USDT (current support) could drive the price lower, targeting 0.2635 USDT (36°).
A break below 0.2635 USDT signals stronger bearish sentiment, potentially revisiting 0.2026 USDT (base level).
Practical Tricks for Using This Chart
Set Alerts on Key Levels:
Use TradingView alerts for price nearing levels like 180° (0.5877) or 144° (0.4943).
Combine Indicators:
Pair Gann levels with RSI or MACD to confirm reversals or trend continuations near key zones.
Monitor Time Cycles:
Watch for price movement near vertical green lines. Combine this with volume spikes to validate potential breakouts or breakdowns.
Use Diagonal Guidance:
Trade in the direction of the diagonal trendlines. For instance, if the price is above an upward diagonal, prioritize long positions.
Wish you best of luck Trading!

#SEI/USDT Ready to go higher#SEI
The price is moving in a descending channel on the 30-minute frame and sticking to it well
We have a bounce from the lower limit of the descending channel, this support is at 0.3510
We have a downtrend on the RSI indicator that is about to be broken, which supports the rise
We have a trend to stabilize above the moving average 100
Entry price 0.3545
First target 0.3619
Second target 0.3702
Third target 0.3800

SEI/USDT 4H Analysis🚨 SEI/USDT 4H Analysis 🚨
Hey fam, SEI is in a Descending Channel, and the chart is looking primed for a reversal. Here’s what I’m seeing:
🔑 Buy Zone:
- $0.30-$0.33 (green zone) – a solid accumulation area.
🎯 Targets:
- TP1: $0.475
- TP2: $0.594
- TP3: $0.708
📌 Game Plan:
- Look for an entry around the lower channel in the buy zone.
- Use 3x isolated leverage (only if you’re confident and risk-tolerant).
- Place your stop below $0.235
A breakout above the channel could trigger a strong move to TP1 and beyond. Always manage risk, and let’s make those gains! 🚀
#SEI #Crypto #TradingViewIdeas

SEI bullish structure shift and pump comingSEIUSDT did bullish CHoCH and now coming down to fill the bullish liquidity orders before taking flight to the moon.

Sei Short---0.33 to 0.317 Just recently opened a SEI short.
85% tp @ 0.3175
close @ $0.0.285
Potential early 70% partial at 0.33
Based on higher timeframes it seems like the market wants a lower price as it keeps getting rejected. Failed to close the week back above the 0.348 level. Attempt to push up today and was met with more selling pressure.
Hence am anticipating that the market will make a new low....the targets I have I would say are conservative> I could see it falling to $0.285 but maybe after another correction, I don't expect it to fall in straight line.
