SEIUST trade ideas

SEI | 3D Macro Setup Still watching patiently.
🔹 Price has broken the parabolic downtrend, but no confirmation of reversal yet.
🔹 AO (Awesome Oscillator) is printing a clean bullish divergence — first signal of momentum shift.
🔹 We’re sitting just above the Point of Control (POC) — the area with the highest volume traded.
📌 My preference:
Would love to see a final flush sub-$0.10 to sweep liquidity → trigger a fast reversal.
But… not convinced we’ll get it. If we don’t — any reclaim above $0.20 likely results in a swift breakout.
🎯 Why this matters:
Once confirmed, there’s very little resistance overhead. The upside could be vertical.
⚠️ Patience here is key. If it breaks up — it’s likely to go fast.

SEIUSDT: Trend in daily time frameWe have two trends, be careful
The color levels are very accurate levels of support and resistance in different time frames, and we have to wait for their reaction in these areas.
So, Please pay special attention to the very accurate trend, colored levels, and you must know that SETUP is very sensitive.

$SEI BREAKOUT ALERT!🚨 BREAKOUT ALERT: NYSE:SEI
After months in a falling wedge, NYSE:SEI finally breaks out of chart targets with over 120% upside from here.
This could be the start of a significant trend reversal.
The chart doesn’t lie — are you in?
#SEI #Crypto #Altcoins
👇 RT if you caught it early!

The Bullish Case of SEI#SEI has been in a downtrend since topping in March 2024, forming what appears to be a wave (2) zigzag correction.
It recently bounced off a key Fib cluster, potentially marking a major bottom.
Passing $0.735 confirms targeting the ATH.
Breaking $0.095 invalidates the idea.

#SEI/USDT Analysis📊 #SEI/USDT Analysis 📊
NYSE:SEI has broken the Daily Diagonal Trendline and is currently holding the Daily FVG—a key bullish sign!
📈 Key Level:
Resistance: PWH $0.186
💡 If this FVG holds, we could see NYSE:SEI explode soon.
Patience might just pay off here!

SEI: Your Altcoin ChoiceThe last session produced the highest volume since November 2024 and activated the baseline of a rounded bottom pattern that launched the first SEIUSDT bullish wave.
SEI's first bullish wave produced more than 1,101% growth. The peak happened in March 2024. After this peak, bearish all the way. The next major low happened on the 7-April 2025 trading session, 3D. More than a year of bearish action. I say this is enough.
A long-term higher low is present vs October 2023. The chart is clear and easy. Market conditions are about to change. The high volume on the more than a year strong higher low indicates that buyers were present. Support is activated but still early. Confirmation comes when multiple sessions close green without the last low, 0.1303, getting challenged again.
I don't think we should wait for confirmation. The wise move would be to do like the whales and start an accumulation phase. Instead of waiting for a certain market condition to be met, once support is hit we start to buy as much as we can. Prices will always fluctuate and fake signals are the norm. The market can move down and pierce support just to produce a fake bearish signal and then grow. It is very hard if not impossible to predict the short, short-term. When focusing on the bigger picture, we know the market is set to grow next. Knowing this, we buy, accumulate, as much as we can in anticipation of this bullish wave.
It is early but a long-term correction is over. What follows, is growth.
Thank you for reading.
Namaste.

Sei scalp longJust now opened a long position on sei.
I attempted to short it earlier but momentum is slow, market is itching to go up. It's high but with the daily trend and I think it will likely spike up today as it flipped bullish on the 15 min tf + formed inverse head and shoulder reversal pattern among other things in confluence with my DTT setup

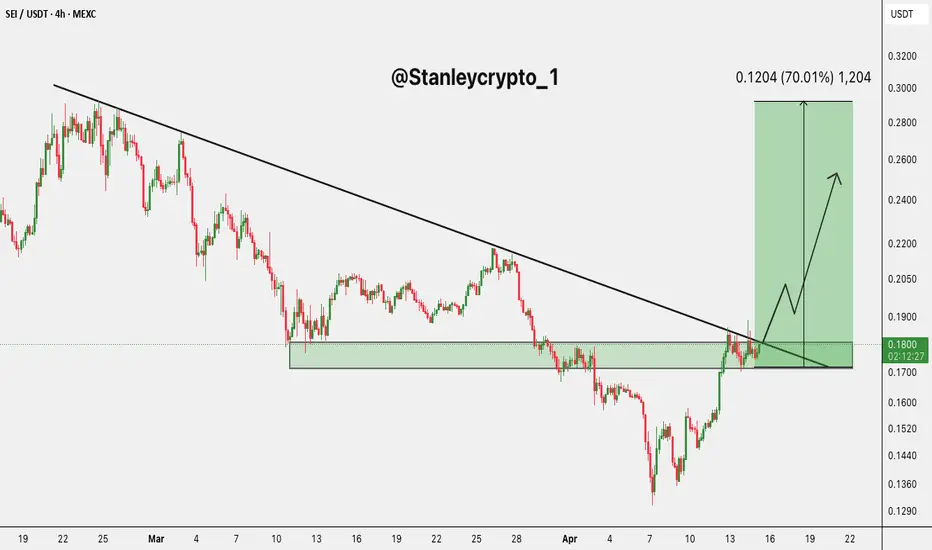
$SEI BREAKOUTNYSE:SEI looking ready to break out! 🚀
Price is testing a key descending trendline and consolidating just above significant support
Bullish breakout scenario could send it flying +70% to $0.30 if momentum follows through 👀
Break and retest zone in play 🔁
#SEI/USDT#SEI
The price is moving within a descending channel on the 1-hour frame, adhering well to it, and is heading for a strong breakout and retest.
We are seeing a bounce from the lower boundary of the descending channel, which is support at 0.1693.
We have a downtrend on the RSI indicator that is about to be broken and retested, supporting the upward trend.
We are looking for stability above the 100 moving average.
Entry price: 0.1700
First target: 0.1724
Second target: 0.1743
Third target: 0.1766

SEI 1D ANALYSISHi friends,
Today we pay attention to the SEI chart in the daily time frame; we have a local resistance level at the price of $0.2143, which is good for long entries after the daily candle closes above it.
It has a strong daily resistance trend line, which, after it breaks and pulls back, allows us to enter into long positions with volume confirmation.
The main daily resistance level is at the price of $0.3446

SeiUsdt LongTradeable idea, this pair broke through the trendline and it considiladated above it, look to open long positions from here.

SEI — Breakout + Strong Fundamentals = Perfect 1:9 SetupFinally broke the downtrend line — and it's not just about the technicals here. Fundamentals on SEI are looking really solid, and that adds even more confidence to the setup.
Planning to load on a small pullback and retest of the trendline — that’s where the real entry lies.
This one’s shaping up to be a textbook 1:9 RR play. Don’t sleep on it.
Enrty: 0.17-0.178
TP: 0.4
SL: 0.15
More thoughts in my profile @93balaclava
Personally I trade on a platform that offers low fees and strong execution. DM me if you're curious.

Sei scalp long to $0.1726Just now opened a long position on sei. Anticipating a pump back up to $0.1726 area at least before more dump...or maybe we just pump right through target

SEI shortJust now opened a short position on SEI. I antiicpate market will fall back to $0.1688 area or lower to retest before any higher prices unless get some high impact bullish news

#SEI/USDT#SEI
The price is moving within a descending channel on the 1-hour frame, adhering well to it, and is heading for a strong breakout and retest.
We are seeing a bounce from the lower boundary of the descending channel, which is support at 0.1754.
We have a downtrend on the RSI indicator that is about to be broken and retested, supporting the upward trend.
We are looking for stability above the 100 moving average.
Entry price: 0.1823
First target: 0.1847
Second target: 0.1884
Third target: 0.1942

#SEI/USDT#SEI
The price is moving within a descending channel on the 1-hour frame, adhering well to it, and is heading for a strong breakout and retest.
We are experiencing a rebound from the lower boundary of the descending channel, which is support at 0.1600.
We are experiencing a downtrend on the RSI indicator, which is about to break and retest, supporting the upward trend.
We are looking for stability above the 100 Moving Average.
Entry price: 0.1614
First target: 0.1625
Second target: 0.1642
Third target: 0.1665

#SEI/USDT#SEI
The price is moving within a descending channel on the 1-hour frame and is expected to continue upward.
We have a trend to stabilize above the 100 moving average once again.
We have a downtrend on the RSI indicator that supports the upward move with a breakout.
We have a support area at the lower boundary of the channel at 0.1700.
Entry price: 0.1730
First target: 0.1764
Second target: 0.1808
Third target: 0.1850

SEIUSDT UPDATESEIUSDT is a cryptocurrency trading at $0.1700, with a target price of $0.4500. This represents a potential gain of over 200%. The technical pattern observed is a Bullish Falling Wedge, indicating a possible trend reversal. This pattern suggests that the downward trend may be coming to an end. A breakout from the wedge could lead to a significant upward movement in price. The Bullish Falling Wedge is a positive indicator, signaling a potential price surge. Investors are showing optimism about SEIUSDT's future performance. The current price may present a buying opportunity. Reaching the target price would result in substantial returns for investors. SEIUSDT is positioned for a potential breakout and significant gains.

SEI - 2 Possibility 1 solutionSo smol range is easy move the big ranges is how it can move to be precise!!

Sei scalp short to $0.1530Just now took this sei scalp short.
Not necessarily according to main strategy. It just seems likely to retest $0.1537 to $0.1530 to me before actually pushing higher.

SEIUSDT 1DSEI ~ 1D Analysis
#SEI Buy gradually after successfully penetrating this resistant line with a short -term target of at least 10%+.

SEIUSDT 3DSEI ~ 3D Analysis
#SEI Buy back while visiting this support with a short -term target of at least 20%+.
