Shiba INU Detailed AnalysisHello All, I am posting my view on Shiba INU and possible movement for future.
1) Short term bullish
2) Mid Short to Mid long term - Neutral
3) Long term bullish.
I have mentioned what should be the buying zones.
GK Trade Manthan
SHIBETH_288285.USD trade ideas

SHIB/USD Buy Trade – Targeting Recovery by Deadline
Pair: SHIB/USD 🐕
Direction: Long 🔼
Target: Recovery above 0.00002210 🎯
Time Horizon: By Sunday, Jan 19, 22:00 UTC
The pair has displayed a sharp decline, followed by signs of stabilization. A potential reversal pattern is forming, suggesting the possibility of upward movement toward the 0.00002210 level.
This trade is time-sensitive, with an expected resolution by Sunday at 22:00 UTC. Broader market sentiment and potential speculative interest in SHIB may influence price action. Monitoring closely for further confirmation of anticipated recovery behavior.

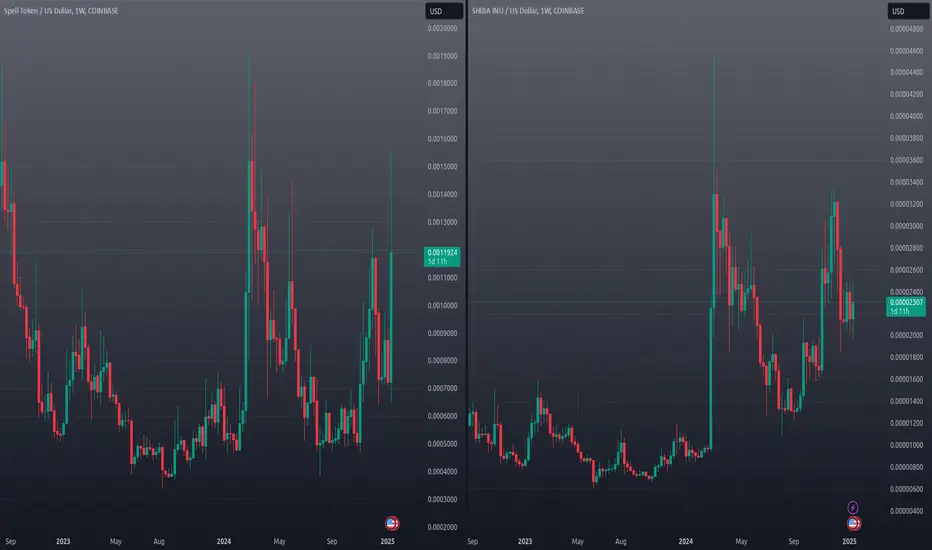
SPELLUSD vs SHIBUSD Correlation ProbabilitySPELL Token from the popular Abracadabra MIM ecosystem has broken out of strong correlation with SHIB which should result in gains to SHIB; typically, when one moves the other follows. I am thus LONG on SHIB as a breakout to the upside is statistically probable.
shibusdhello guys hope your doing well
here is shibusd idea i m looking shib long till recent high so focus on it and try to trade with your own entry confirmation i just share my idea not a financial advice.
thanks.

Double Bottom in ProgressI spot another pattern on SHIBA which is more into double bottom progress as it can't break down the strong support at 0.00002111 and now tries to break up the neckline area to reach a target at around 0.0000274, aligning with the majority expectation of bullish movement that came from jumped in trading volume and rolling out of new projects, products, and community being involved. For those who want to favor this momentum wait until the appearance of a solid candle that is close above the neckline.


Shiba Inu💰 Shiba Inu
Timeframe: W
A meme coin that has yet to realize its full potential. I anticipate a breakout from the triangle to the upside. The most likely target is 0.00010.
#SHIB CRYPTOCAP:SHIB #Crypto #Trading #Investing #Stocks

SHIBUSD Best Level to BUY/HOLD 30% gains🔸Hello traders, today let's review 2hour price chart for SHIB . Range locked price action last few weeks, however there is still room left for a decent bounce off the lows.
🔸SHIB currently is in the consolidation stage, however strong stack of order blocks below highlights bullish liquidity. Once triggered I'm expecting decent reaction and bounce off the lows.
🔸Recommended strategy bulls: Wait for the price action to trigger liquidity order block below market price, BUY/HOLD near 1950, SL below range lows, TP Bulls / exit at 2500 near bearish
order block resistance zone. 30% unleveraged gains in this trade. good luck.
🎁Please hit the like button and
🎁Leave a comment to support our team!
RISK DISCLAIMER:
Trading Futures , Forex, CFDs and Stocks involves a risk of loss.
Please consider carefully if such trading is appropriate for you.
Past performance is not indicative of future results.
Always limit your leverage and use tight stop loss.

double bottomsIs SHIB forming another double bottom?
A few candles back on the weekly chart SHIB formed two double bottoms on a trendline. SHIB *could be* forming another double bottom on top of Demand Zone in a FVG on the same trendline. Using the 'line with markers' chart to get another view of price action. Please be mindful this is a weekly chart, and the double bottom is not confirmed and be careful this is crypto. God bless

Optimistic scenarioIn this scenario, we're facing a symmetrical, and it's finishing the g in a few hours.

SHIB's Last CandleSHIB needs a miracle for a price reversal. If 0700 comes with a reversal candle, SHIB holders have a chance. The candle finishes printing at 0700 today. Currently it is forming a Wicky Candle(candle with shadows, wicks) this candle is in a FVG and on top of a Demand level near an upward trend and in a upward parallel channel. Be wary of the parallel structure watch out for signs of reversal(positive) or breakout(bearish) and consolidations. God bless you all be careful.

b of the triangle is finishingIt seems that b leg of the assumed triangle is finishing and then c will be formed in 14-15 days.

Cycling back up?SHIB is moving nicely back in the parallel structure but watch out for possible corrections when price reaches FVG's (red blocks on the chart). Hopefully, price can cycle all the way to the top,but this is crypto.

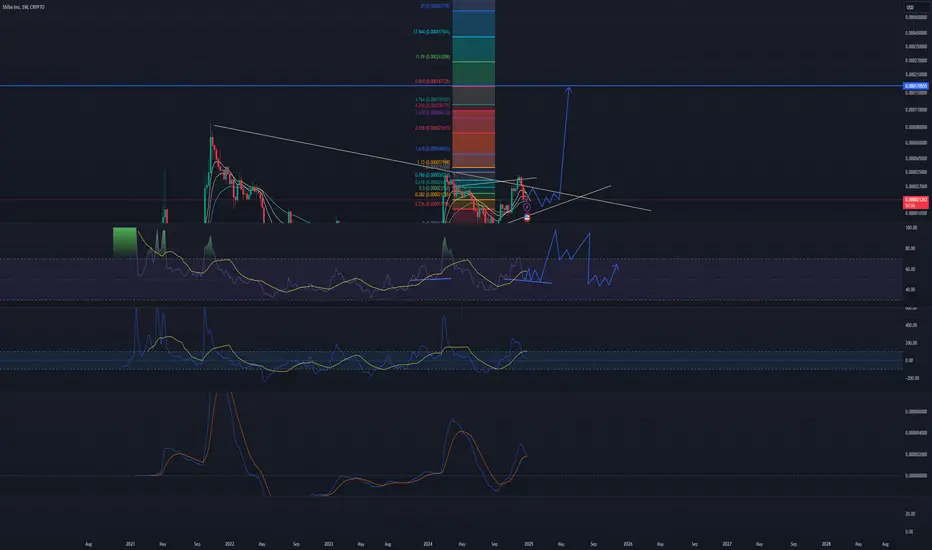
SHIBA/USD Analysis: Preparing for a Potential BreakoutElliott Wave Structure:
Wave Count:
The chart illustrates a completed 5-wave corrective structure (labeled 1 through 5 in yellow).
A possible ABC corrective wave is underway, suggesting the start of a bullish retracement phase.
Breakout Potential:
Price is testing a key resistance level at 0.000027, a critical zone to confirm bullish continuation.
If the resistance is broken, we may see a rally targeting higher Fibonacci extension levels.
Key Indicators:
Descending Channel:
The pair is breaking out of the long-term descending channel, indicating a shift in market sentiment.
High-High Momentum:
Consecutive higher highs suggest growing buyer interest.
A sustained move above the Ichimoku cloud confirms bullish dominance.
Targets:
Immediate Resistance: 0.000027 (critical breakout level).
Fibonacci Target: 0.000032 (short-term upside).
Conclusion:
SHIBA/USDT is positioned at a pivotal resistance zone, with a potential for a bullish breakout to 0.000032. However, failure to sustain above 0.000027 could lead to retesting lower supports.
📢 Disclaimer:
This analysis is for informational purposes only and is not financial advice. Please conduct your own research before making trading decisions. 🛑

Shiba 200% potential upside - Tesla similaritiesShiba is holding a vital support as of right now. We want to see the crypto market react here and continue upwards and these areas are great to accumulate strategically. You could have a SL below the low at around .2027 if you wanted to be super tight, however it is easier to accumulate and watch the price action carefully around this level, we want to hold the support and not break below.
Also, we posted the linked TESLA chart a few months ago, notice the similarities. This doesn't mean it'll happen again, more of an interesting observation. Follow the PA carefully.

SHIBUSD - The Elusive 80/20 CandleAh, the elusive 80/20 candle...
I've been talking about the 80/20 candle quite a lot and there are of course different types. One is red which is starting to form on VARA's weekly chart, it has not confirmed there yet but on SHIB's chart we have a full fledged 80/20 hammer candle and because the candle is green the candle can exceed 20% and still be considered confirmed. The way it often works is a large wick forms off of support level which in this case is that massive order block just below the wick. This indicates that traders, especially bargain traders have chosen that is the best price in that session and thus everyone buys in. The result is often a very quick V recover similar to what we often see in the stock market following any random crash.
While the 80/20 candle doesn't guarantee a reversal it has a very high statistical success rate of 80% plus depending upon the asset class you are looking at. Just be warned that the success rate in this specific asset class is a little lower on the lower time frames but very high on the weekly and monthly candle chart.
I am not a financial advisor. Trade safely my friends.

get this thing while it dropsleft right looks like minute patterns. the middle one is the big move. 10x up from there.
Short term hopeThe daily trend line may have a breakout on the 4 HR Time Frame, with a MACD( Chris Moody) bullish cross over. Be very careful, please be patient and wait for confirmations.

Another factor in the equationThe MACD may have a bullish cross over below the zero line, that with a strong price breakout from the short term trendline (in yellow on the chart) maybe a glimmer of hope.

Please be carefulSHIB has broken out of it's main structure and appears to be forming a head and shoulders. Is this the power of tax harvesting, do you see recovery in sight? please kindly comment below.

Shiba Inu Analysis: Key Levels and Trends 24.12.30Hello, this is Greedy All-Day.
Today’s analysis focuses on Shiba Inu (SHIB).
Daily Chart Analysis
The daily chart shows that Shiba Inu recently broke below its short-term ascending trendline, which began in August 2024, within the blue box zone.
After the breakdown, the price formed a long lower wick and bounced back. This rebound occurred near the green box support zone, although slightly above its previous lows, indicating that the green box has strong support.
Key Observations:
Shiba Inu now appears to have entered the yellow box supply zone.
Although it is currently positioned near the top of this zone, if a strong rebound does not occur, the price is likely to continue falling toward the bottom of the yellow box.
Critical Level to Watch:
2056 Satoshi (white box)
This level has not been tested since the sharp decline earlier.
If the price fails to hold this level, there’s a high probability of another test of the green box support zone.
Should the green box support also fail, the price is expected to drop to the bottom of the yellow box zone.
For a Bullish Reversal:
The price needs to break above the red box lower boundary to confirm a potential rebound. Further explanation is provided in the next section.
Ichimoku Cloud and Moving Averages Analysis
To trigger a trend reversal, Shiba Inu must enter the red box supply zone, with the specific level being a 2480 Satoshi breakout.
Key Points for Reversal:
A break above 2480 Satoshi is critical to enter the upper portion of the red box.
This breakout would also mark an entry into the Ichimoku Cloud, currently acting as resistance.
Additionally, it would reverse the direction of the death cross in the moving averages, allowing for a potential bullish shift.
Until Shiba Inu stabilizes above 2480 Satoshi, it’s advisable to remain cautious with buy positions.
Conclusion
Shiba Inu is at a pivotal moment:
Bullish Case: A 2480 Satoshi breakout would mark a trend reversal and provide a stronger bullish signal.
Bearish Case: Failure to hold 2056 Satoshi could lead to further downside, potentially testing the green box and, if that fails, the lower boundary of the yellow box.
At this time, remaining patient and observing key levels is the safer approach. Let’s trade wisely and prepare for both scenarios. 🚀


The SqueezeGood day friends in this mercurial market on the 4 hour chart we have SHIBA consolidating and also a possible BB squeeze.
Per our friend Google "When Bollinger Bands narrow, it indicates that the market or security is experiencing less volatility and may be about to have a significant price move:
This is known as a "squeeze" and suggests that a big move is ahead"" Here on the chart it may appear that BB is narrowing, let's keep our eye on the breakout of the parallel structure, which will act as a confluence. "When Bollinger Bands narrow significantly and the price then breaks above the upper band or below the lower band, it is often interpreted as a strong signal of a potential trend change, signifying a breakout or breakdown, as this indicates a period of low volatility followed by a sudden increase in price movement, often considered a "squeeze" with the breakout signifying a significant price move either upwards or downwards depending on which band is breached; essentially, the market is poised for a large move after a period of consolidation"(Google).
