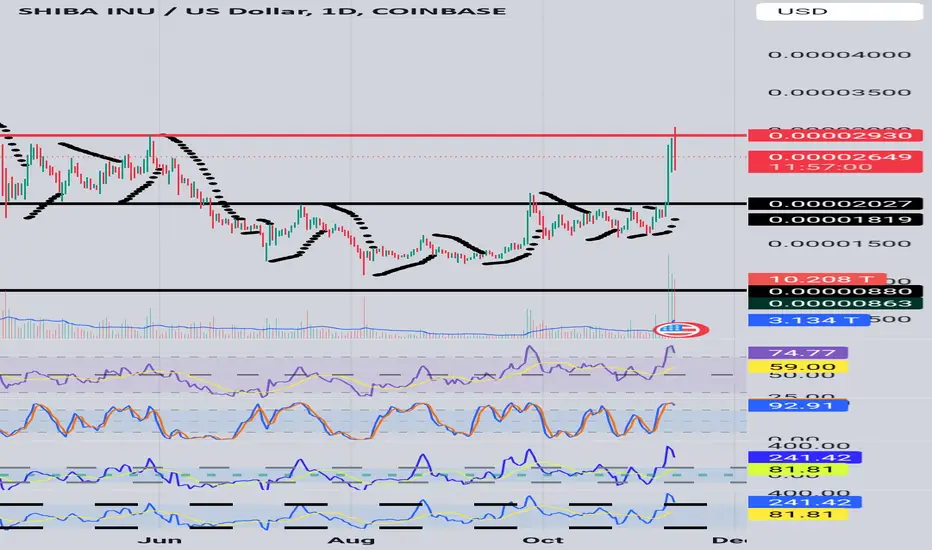
Shiba Prints a Triangle, When Will It Break?Here on COINBASE:SHIBUSD we can see recent Price Action is outlining a Triangle Pattern having Pushed up through the Sept. Highs after the Pro-Crypto Trump Administration won the Presidency, and being rejected from May Highs!
Price has been able to find Minor Support in the .000023 - .000022 area, but based on Tests 1 and 2 of the Falling Resistance showing Less Volume with each touch, Buyers seem to be losing their strength.
Every Trendline needs at least 3 Tests to Validate their Strength and Probability of holding Price and we are currently waiting on that 3rd Test potentially in the .000027 area.
-If the Falling Resistance is able to hold Price, we could see it decline to the nearest area of Structure being the Support from the Sept. Highs @ .000021 - .000020
-If the Falling Resistance is broken, Price creating a new Higher High must be followed by a significant amount of Volume Validating the Break otherwise it could be a False Break!
The 200 EMA and DSR have printed a Golden Cross increasing the probability of Bullish moves to come!
Indicators:
- Price Trading Above 200 EMA
- RSI Above 50
- BBTrend Printing Green Bars
SHIBPERP trade ideas

LevelsGreetings
SHIB on the monthly needs to close above March 2024 closing price to continue the uptrend and not form a double top and have a possible price reversal. RSI and SRSI are very healthy for now. Have a safe day

BattleGreetings
SHIB RSI is around 70 it is in an uptrend and RSI levels for overbought is 80, SHIB is above 10 and 50 EMA, even though SHIB at the moment is engulfed in an old Supply Zone there is still and unfilled Wick above it. SHIB may be engulfed in an old Supply Zone and it has two major resistances to surpass before getting close to all time highs.
Have a safe day

Shib to .00004566Some great momentum coming after 2 billion shib were burned.
Been holding 4 years now. Happy to see some action finally.

Can we get another 40% leg up with $SHIB?Last hoorah SHIB had with a double bottom pattern resulted in a 40% increase in price over 24 hours. As you can see, SHIB has formed and completed another double bottom with upward momentum following. If ETH can act right I feel this leg up will be just a much as the last, maybe more.

SHIBA is gearing up for cycle topHere is the upcoming price action and wave count for rest of the cycle.. slow grind up should break the cycle top in next few months

SHIB - Journey back to ATH #memecoins #shibWith all the memecoin hype in the market, and retail coming back in its just a matter of time before shib gets a massive pump
Decent r/r here and were only a 3.5x away from previous ATH, which I expect to blow past sooner or later
Mid term hold on this

SHIB/USDPossible 250% gains incoming for SHIB!
I have taken the fractal from DOGE (also seen in the screenshot on the right of DOGE's chart), and placed in on SHIB's chart.
SHIB seems to be mirroring what DOGE previously did. Of course, the charts are different, meaning, Fib extensions will be a bit different. I am confident that SHIB will be one of the next altcoins to make a move.
Not financial advise!

SHIBUSD: Expecting a massive pump soon.Shiba Inu just turned bullish on its 1D technical outlook (RSI = 59.750, MACD = 0.000, ADX = 25.625) but practically remains ranged inside a Bull Flag. As long as the 1D MA200 supports though, the trend will be bullish, coming off the HL Zone and a 1D Golden Cross. The Golden Cross before that (December 1st 2023) led to a similar Bull Flag, which after testing and holding the 1D MA200, it broke upwards aggressively to a +575% rise. We expect a similar outcome (TP = 0.000073).
## If you like our free content follow our profile to get more daily ideas. ##
## Comments and likes are greatly appreciated. ##


SHIB Daily Chart Break OutSHIB has a great break out from descending triangle and a great SRSI bullish crossover. Also, observe we are above the 200EMA. I moved RSI Overbought zone from 70 to 80 so stay alert and watch out for CCI levels over 200.

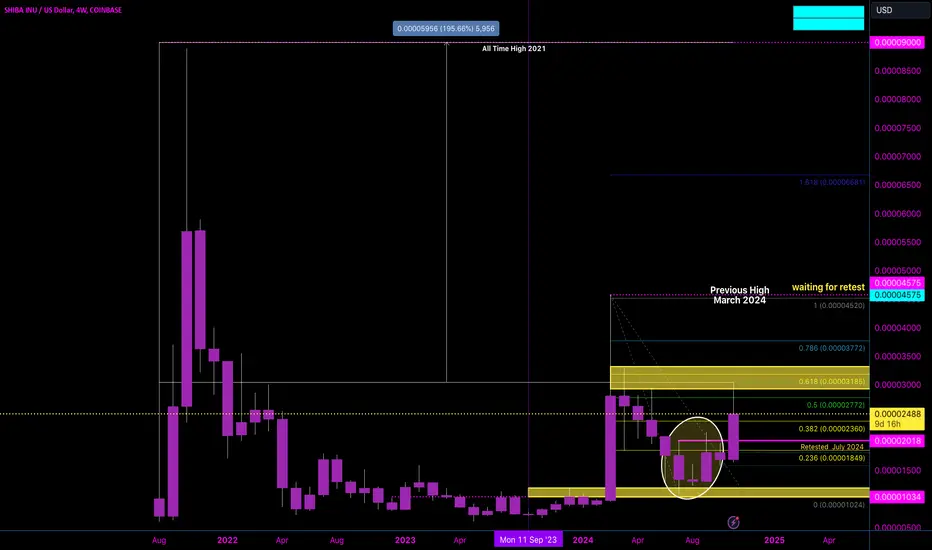
SHIBA INU PRICE CHART BREAKDOWNShiba Inu (SHIB) is lookin' REAL juicy on the 4W chart!
Here's the lowdown:
💎 What’s Got Me Hyped About SHIB 💎
Check it—there’s a Doji Star pattern chillin’ on the 4-week chart.
Doji Vibes:
A Doji is that candle where the open and close prices are almost twins, showing the market's all confused.
Usually pops up after a dip or during a pause—translation? This could mean a reversal’s on deck!
📊 Levels to Watch:
Retest Alert: That 0.00004575 zone? It's looking primed for a retest—likely around March 2024. 🚀 (Yep, that 0.618 Fib level’s in play.)
Bullish Goals: If SHIB keeps up the heat, we could be lookin’ at 0.00006030 (+203% 🔥) or even a shot at 0.00009000 (all-time highs!) 🐕💎
The Dog’s been snoozing since 2021, but I swear it’s about to go BONKERS!
💥 Breakout Watch:
I’m still waiting for that BIG move on this token. Keep your eyes peeled for:
Green Candle Confirmation: A fat green candle closing above the Doji high could lock in the reversal.
Support Levels: Check how SHIB handles 0.00002018 - 0.00003185 for extra strength vibes.
This Doji Star might just be the signal we’ve been waiting for to take SHIB to the NEXT LEVEL. Let’s get it
Caution Bearish MACD crossover on the daily Time Frame.
The good news it is still consolidating inside the triangle and respecting the upward trendline.
Watch out for break of triangle and trendline toward the downside.

Consolidation SHIB is consolidating in a triangle, still in an upward trend. CCI levels are positive. RSI levels are positive, MACD could be possibly have a bullish cross over in the future. But be very careful and watch out for breakouts and possible retest, and it is a descending triangle.

PatternsThank you for your time.
Chart patterns are very subjective, but do you see a bull flag pattern and a inverted head and shoulder pattern inside of it forming? We need a confirmed break out from the parallel structure and the resistance line combine with good RSI readings and SRSI readings to confirmed theory. Candle is still printing

Short term trend line 12 TFGreetings. Thank you for your time.
SHIB is currently on a trendline, and it has positive CCI levels and the MACD is alluding to bullish crossover, RSI levels are healthy. Let us wait for the candle to print and hope for a positive breakout on the short term trend-line.

Breakout needed SHIB needs to break out this parallel channel. At this time it is making lower lows and lower highs. RSI is within acceptable ranges.

My Goals for shibusdtAll details are drawn on the chart
Breaking the support area doesn’t mean that it’s a good chance to buy although I don’t think that it will
So waiting till the end of this year to reach my Goals

SHIBA still in the fightPositives- the signal for the bottom CM Williams Fix Vix indicator is flashing green, hypothesizing that the bottom is in or forming
-price forming above the 21 EMA
-RSI is healthy but not spectacular
-CCI is positive but not high
-price forming around 50% Fib Level
Negatives
-no bullish candle printed yet
-still in downward parallel channel
- no bullish activity yet on the SRSI
Be very careful and keep an eye on the negatives check timeframes and wait for the candle to print.

Will it continuePossible reversal long wick candle forming on 12 hr Time Frame with SRSI approaching oversold levels. SHIB may possibly but not certain look like it could be making new trendline. Keep and eye if SHIB can break out of channel

Shiba INU ready to fall ... Hello you all would have seen the bull run I had predicted long time back ... Beware I am expecting a fall in crypto currency all, Are forming negative patterns at the top ... stay away from the trap
Gautam Khanna
GK trade Manthan

SHIBIDY BIBIDYnot yet confirmed but could be a massive cup and handle formation on the weekly chart.
i'm highly skeptical this plays out but just wanted to point out the formation.
not trading advice and have patience
TJG

Friendly ReminderJust a friendly notification, to check resistance levels and Oversold/overbought indicators and watch out for candles and wait for the candle to print. SHIB is lingering around a resistance level and RSI and SRSI and CCI levels indicate caution overbought territory. Have a bless day.