AAPL- RECESSION FEARS & YEN CARRY TRADEApple: Navigating Market Challenges and Capitalizing on Future Opportunities
As of today, Apple Inc. is experiencing significant market volatility, driven primarily by heightened recession fears and the impact of the yen carry trade. Recent market conditions have led to a noticeable drop in Apple's stock price, reflecting broader investor concerns about the global economic outlook. However, despite these challenges, there is a silver lining, and a target price of $240 is now within reach.
Market Challenges
The current downturn in Apple's stock can be attributed to several macroeconomic factors. Concerns about a potential recession have been exacerbated by central banks' tightening monetary policies and geopolitical uncertainties. Additionally, fluctuations in the yen carry trade have added pressure on the stock, as investors reassess their risk exposure in light of changing interest rates.
A Promising Outlook
Despite these short-term setbacks, Apple is well-positioned to recover and thrive in the coming months. Many analysts believe that the worst may be behind us, as the company remains resilient with a strong balance sheet and a loyal customer base. Apple's ability to innovate and adapt to changing market conditions has been a hallmark of its success.
The anticipated continuation of the supercycle is a key factor supporting this optimistic outlook. The impending release of Apple's next-generation products, including AI-powered phones, tablets, and Macs, is expected to drive a significant upgrade cycle. This innovation cycle could reignite consumer demand and bolster Apple's revenue growth.
The Role of AI
A crucial component of Apple's future growth strategy is its foray into artificial intelligence (AI). As the "Apple Intelligence" AI story unfolds, the company is poised to leverage AI to enhance its product offerings and create new customer experiences. The integration of AI into Apple's ecosystem will likely catalyze a new wave of demand, as consumers seek cutting-edge technology that offers greater functionality and personalization.
Apple's investment in AI not only strengthens its competitive position but also opens up new revenue streams, particularly in areas such as augmented reality, machine learning, and personalized services. This strategic focus aligns with the broader industry trend of AI adoption, positioning Apple as a leader in this transformative field.
Conclusion
In conclusion, while Apple faces current market headwinds due to recession fears and the yen carry trade, the company's robust fundamentals and innovative pipeline suggest that brighter days are ahead. The anticipated upgrade cycle, coupled with the integration of AI into its product suite, presents a compelling growth opportunity. Investors with a long-term perspective may find Apple's current valuation attractive, with the potential for substantial gains as the company navigates these challenges and capitalizes on future opportunities.
AAPL.USD trade ideas

Apple Analysis(Target)I have analyzed Apple Inc using the Gann technique, trend analysis & waves. I have found that it is in immense down trend. And target is apple. Apple is more weak after the tariff announcement.

Apple (AAPL) Shares Plummet Over 9% Following Trump's TariffApple (AAPL) Shares Plummet Over 9% Following Trump's Tariff Announcement
Many stock indices declined after the US President announced the introduction of tariffs for multiple countries, as we reported yesterday morning. During yesterday’s trading session, the sell-off in equities intensified.
According to media reports, market participants had hoped that the tariff threats were mere rhetoric and a negotiation tactic. However, many were shocked by both the number of countries affected and the scale of the imposed tariffs. Several well-known technology companies led the market downturn.
How Do Trump's Tariffs Impact Big Tech Companies?
Significant tariffs were imposed on Chinese imports, yet Apple manufactures around 90% of its iPhones in China. Many affordable products sold on Amazon are also set to become more expensive, as they are sourced from China.
Meta Platforms' advertising business could suffer considerable losses as companies worldwide cut advertising budgets. Nvidia and Broadcom may also struggle, given that the tariffs apply to many electronic devices incorporating their chips.
As a result, shares of Apple (AAPL), Amazon (AMZN), Meta Platforms (META), Broadcom (AVGO), and Nvidia (NVDA) fell by approximately 9% by the close of trading yesterday.
Microsoft (MSFT) shares, however, proved more resilient, dropping just 2.3%, as software products are not easily subject to tariffs. Moreover, software developers do not rely on international supply chains.
Technical Analysis of AAPL Chart
Apple’s stock price fluctuations have formed a trend channel (shown in blue), with:
→ The upper boundary acting as resistance since last autumn, although bulls managed to push the price above it during the Christmas rally. We previously highlighted Apple’s overbought condition and the possibility of a correction on 27 December 2024.
→ New data indicates that resistance has now shifted to the median at around $225.
This puts the lower boundary of the trend channel at risk of a bearish breakout. In the coming days, AAPL’s chart may see a bearish assault on the psychological $200 level, which proved significant in August 2024.
This article represents the opinion of the Companies operating under the FXOpen brand only. It is not to be construed as an offer, solicitation, or recommendation with respect to products and services provided by the Companies operating under the FXOpen brand, nor is it to be considered financial advice.

WILL APPLE (AAPL) BREAK SUPPORT ON 1 HOUR CHART? CRASH INCOMING?The California based AAPL is down nearly -18% since March. It appears to be approaching some key support trend lines. Will the support prices hold for this tech giant? Are Trump Tariff's fueling a sell off?
Disclaimer: Not financial advice.

AAPL - Weekly ChartAs described in the picture, the gray box may act as strong Support and bounce the price up, at least for a while.

Apple (AAPL) has just broken it's 22 yearlong Uptrend line.Apple (AAPL) has just broken it's 22 yearlong Uptrend line.
Using Victor Sperandeos (trader's Vic) strict definition of correctly drawing Uptrend lines.

Apple - All This Was Expected!Apple ( NASDAQ:AAPL ) perfectly plays out:
Click chart above to see the detailed analysis👆🏻
Just a couple of months ago, Apple perfectly retested the rising channel resistance trendline and has been creating the expected bearish rejection. This could perfectly form the next all time high break and retest, which would eventually lead to another significant move higher.
Levels to watch: $190
Keep your long term vision,
Philip (BasicTrading)

AAPL: Key Support at 202 – Watch for Future TrajectoryAAPL seems to have support around 202, where the 100-week moving average lies. Watch this level closely, as it could hint at the future trajectory.

Apple & Tarrif'sI am looking at price action to continue to drop to the monthly key zone due to overall market rejection of the latest tariff news.
I would be looking at recovery if it approaches the daily break zone.
Overall, I would wait and see what the /ES will act throughout the day; uncertainty is still high therefore a conversative play would be ideal imo.

AAPLToo bad,
Apple may lose its Royal World temporarily.
It is getting short position till 3rd Quarter.

Trading Strategy (XAUUSD) April 3, 2025On Wednesday, Trump announced he would impose a 10% base tariff on all imports into the United States and higher tariffs on dozens of other countries, including some of America's largest trading partners, deepening a trade war that has shaken global markets and rattled U.S. allies. The Trump administration also confirmed that his 25% global auto and truck tariffs will take effect as scheduled on April 3, and tariffs on imported auto parts will be imposed on May 3.
XAUUSD trading strategy around the price zone:
SELL XAUUSD around 3175-3177
Stoploss: 3182
Take Profit 1: 3168
Take Profit 2: 3162
Take Profit 3: 3157
BUY XAUUSD around 3128-3130
Stoploss: 3123
Take Profit 1: 3135
Take Profit 2: 3141
Take Profit 3: 3148
Note: Always set Stoploss in all cases to be safe

Calibrating Trading Indicators for Different MarketsCalibrating Trading Indicators for Different Markets: A Beginner's Guide
(Simple Steps to Adjust RSI , MACD , and Other Tools for Better Results)
Key Idea : Just like you'd tune a guitar differently for rock vs. classical music, trading tools like RSI or MACD need adjustments depending on what you're trading (stocks, crypto, forex) and how it moves. This guide shows you how to tweak these tools using price swings (pivot points) to make them work better for your specific asset.
---
Why "One Size Fits All" Doesn't Work
Most traders use default settings for indicators (like RSI's 14-day period). But these defaults were created for "average " markets. Real markets aren't average!
Example:
- Crypto ( CME:BTC1! ) : Super volatile → Needs faster, more sensitive indicators.
- Blue-Chip Stocks ( NASDAQ:AAPL ) : Less wild swings → Needs slower, smoother indicators.
If you use the same RSI settings for both, you'll get bad signals. Calibration fixes this.
---
The Pivot Point Method for Calibration
One effective approach to calibration is measuring the natural rhythm of price swings between high and low points. Here's how to do it step by step:
Step 1: Find Pivot Points on Your Chart
Pivot points are like "price turning points." Use TradingView's ZigZag indicator (or draw them manually) to spot these swings.
How to Add ZigZag on TradingView :
1. Open your chart.
2. Click "Indicators" → Search " ZigZag " → Select it.
3. Adjust settings (defaults work fine for starters).
The ZigZag will draw lines between significant highs (peaks) and lows (valleys).
---
Step 2: Measure the "Rhythm" of the Market
Count the bars (candles) between pivot points to find the market's natural cycle.
Example :
- If Bitcoin swings from peak to peak every 14 bars on average, its "cycle" is 14 bars.
- If Apple does this every 16 bars, its cycle is 16 bars.
In the picture above, we used the Williams Fractal to identify pivots.
Formula for Indicator Settings :
- RSI Period = Half the average cycle → If cycle = 16 bars → RSI = 8 days.
- MACD Settings : Fast EMA = ¼ cycle, Slow EMA = ½ cycle → Cycle = 16 → Fast EMA = 4, Slow EMA = 8
---
Step 3: Test Your Calibrated Indicators
Backtest on TradingView :
1. Add your indicator (e.g., RSI) with the new settings.
2. Use the Strategy Tester (click "Add to Chart" → " RSI Strategy ") to see if signals improve.
Look For :
- Fewer false signals (e.g., RSI saying "oversold" too early).
- Clearer trends (MACD crossovers matching price moves).
---
Calibrating Popular Indicators (Simple Rules)
1. RSI (Relative Strength Index)
- Default : 14 days.
- Calibrated : Half the average cycle length.
- Example : Cycle = 16 bars → RSI = 8 days.
Why It Works : Shorter RSI reacts faster to volatile markets (like crypto).
2. MACD
- Default : 12, 26, 9.
- Calibrated :
- Fast EMA = ¼ of cycle.
- Slow EMA = ½ of cycle.
- Signal Line = ⅙ of cycle.
- Example : Cycle = 20 → Fast = 5, Slow = 10, Signal = 3.
Why It Works : Matches the asset's natural momentum shifts.
3. Williams %R
- Default : 14 days.
- Calibrated : Same as RSI (half the cycle).
---
How to Avoid Common Mistakes
Mistake 1 : Overfitting (Making It Too Perfect for the Past)
- Problem : If you calibrate too precisely to old data, it might fail in the future.
- Fix : Test on 2 types of data:
1. Training Data : First 70% of your chart (to calibrate).
2. Testing Data : Last 30% (to check if it still works).
Mistake 2 : Ignoring Market Changes
- Problem : What works today might not work next month.
- Fix : Recheck your settings every 3 months or after big news (e.g., Fed rate hikes).
---
Free Tools to Help (No Coding Needed)
1. TradingView's "Auto-Detect Cycle" Scripts
Search for indicators like "Cycle", "RSI Adaptive" or " Rainbow Adaptive RSI " in TradingView's public library. These automatically calculate cycle lengths (Not tested).
2. Adaptive MACD/RSI Indicators
Try pre-built adaptive indicators like:
- Adaptive MACD : Adjusts itself based on volatility.
- Dynamic Pivot : Uses pivots to set stop-loss and take-profit levels.
---
Building a Simple Pivot Calibration System
Basic ZigZag Calibrator Method :
1. Add ZigZag to your chart.
2. Manually count the bars between 5 recent swings.
3. Calculate the average → Divide by 2 → Use that number for your RSI/MACD.
Example :
- Swings: 12, 14, 16, 10, 8 bars → Average = 12.
- Calibrated RSI = 6 days.
---
Why This Works (Without the Math)
Markets move in waves. By matching your indicator's speed to the wave length, you "surf" the trend instead of fighting it. Research shows adaptive methods like this beat default settings.
The Science Behind It
When you calibrate to an instrument's natural rhythm:
- Oscillators (RSI, %R) catch extremes at the right time
- Trend indicators (MACD) signal changes faster
- Volatility bands (Bollinger Bands) expand and contract appropriately
---
A Step Further: Multi-Timeframe Calibration
For even better results, calibrate across timeframes:
1. Calculate cycles on daily charts for swing trading
2. Calculate cycles on 4-hour charts for day trading
3. Use both calibrated indicators together for confirmation
---
Final Tips for Beginners
1. Start Small : Calibrate one indicator (like RSI) first.
2. Use Free Tools : TradingView has thousands of free scripts to automate calculations.
3. Keep Records : Document what settings work for which assets.
4. Be Patient : Finding the right calibration takes time, but the results are worth it.
Calibration isn't about being perfect—it's about making your tools work better for specific markets . Happy trading!

Apple May Have PeakedApple has tried to bounce recently, but some traders may think the tech giant has peaked.
The first pattern on today’s chart is the February low of $225.70. AAPL broke under the level on March 11 and has stayed there since. That may suggest old support is new resistance.
The stock has also remained below a 50 percent retracement of last month’s slide, which may confirm downward price action.
Third, the bounce in the last 2-3 weeks may be viewed as a potential bearish flag. Would a move under the line represent a breakdown?
Next, stochastics are nearing an overbought condition. A dip from here may suggest the recent strength is fading.
Finally, AAPL is one of the most active underliers in the options market. (Its average daily volume of 897,000 contracts in the last month ranks third in the S&P 500, according to TradeStation data.) That may help traders take positions with calls and puts.
TradeStation has, for decades, advanced the trading industry, providing access to stocks, options and futures. If you're born to trade, we could be for you. See our Overview for more.
Past performance, whether actual or indicated by historical tests of strategies, is no guarantee of future performance or success. There is a possibility that you may sustain a loss equal to or greater than your entire investment regardless of which asset class you trade (equities, options or futures); therefore, you should not invest or risk money that you cannot afford to lose. Online trading is not suitable for all investors. View the document titled Characteristics and Risks of Standardized Options at www.TradeStation.com . Before trading any asset class, customers must read the relevant risk disclosure statements on www.TradeStation.com . System access and trade placement and execution may be delayed or fail due to market volatility and volume, quote delays, system and software errors, Internet traffic, outages and other factors.
Securities and futures trading is offered to self-directed customers by TradeStation Securities, Inc., a broker-dealer registered with the Securities and Exchange Commission and a futures commission merchant licensed with the Commodity Futures Trading Commission). TradeStation Securities is a member of the Financial Industry Regulatory Authority, the National Futures Association, and a number of exchanges.
Options trading is not suitable for all investors. Your TradeStation Securities’ account application to trade options will be considered and approved or disapproved based on all relevant factors, including your trading experience. See www.TradeStation.com . Visit www.TradeStation.com for full details on the costs and fees associated with options.
Margin trading involves risks, and it is important that you fully understand those risks before trading on margin. The Margin Disclosure Statement outlines many of those risks, including that you can lose more funds than you deposit in your margin account; your brokerage firm can force the sale of securities in your account; your brokerage firm can sell your securities without contacting you; and you are not entitled to an extension of time on a margin call. Review the Margin Disclosure Statement at www.TradeStation.com .
TradeStation Securities, Inc. and TradeStation Technologies, Inc. are each wholly owned subsidiaries of TradeStation Group, Inc., both operating, and providing products and services, under the TradeStation brand and trademark. When applying for, or purchasing, accounts, subscriptions, products and services, it is important that you know which company you will be dealing with. Visit www.TradeStation.com for further important information explaining what this means.

Apple (AAPL) Gains Momentum with 5 Swing Rally, Upside LikelyApple Inc. ( NASDAQ:AAPL ) is showing signs of strength as it builds momentum in a classic Elliott Wave structure. Today’s chart highlights a 5-swing rally from 208.4 low that has propelled the stock higher, signaling potential for further upside in the near term. After establishing a solid base, NASDAQ:AAPL has completed a 5-swing sequence—a bullish pattern often seen in trending markets. The rally began from a key support zone of 184.6 – 209.5. The latest leg up has ended wave (1) in 5 swing, suggesting the short term trend shifts to the upside. As long as pullbacks hold above the recent swing low, the path of least resistance is upward.
The immediate support sits at the prior swing low at 208.4. A hold above this zone keeps the bullish outlook alive. A break below this critical level would negate the bullish view, potentially signaling a deeper correction. Expect pullback in wave (2) to find support in 3, 7, or 11 swing for further upside. For those looking to join the trend, consider waiting for a 3 waves dip toward 100% – 161.8% Fibonacci support to optimize the risk-reward ratio. Define your entry, stop loss, and target ahead of time—tools like the Position Size Calculator can help fine-tune your approach.

Heading for 4 days of strong gains, gold gets support from TrumpIn the Asian session, spot gold
XAUUSD
continued to rise, surpassing $3,145/ounce, up more than $24 on the day.
The global trade war has caused concerns in the market, continuing to push gold prices to new highs. Gold prices rose 8% in March and have increased for three consecutive months this year.
Gold prices have increased more than 18% this year, following a 27% increase last year, thanks to a favorable monetary policy environment, strong central bank buying and demand for exchange-traded funds (ETFs).
Trump: Tariff details could be announced soon (Bloomberg)
US President Trump said on Monday local time that details of the tariffs could be announced either Tuesday night (April 1) or April 2.
Trump also said the US would be “very friendly” to other countries and that tariffs could be significantly reduced in some cases. Trump then talked about other issues before returning to the tariff issue, adding: “The tariff plan is in place.”
White House spokeswoman Karoline Leavitt said on Monday that US President Trump will announce the reciprocal tariff plan “country by country” in the White House Rose Garden on April 2 and that no tariff exemptions are currently being considered.
In the latest escalation in the trade war, Trump is set to impose broad “reciprocal” tariffs on all U.S. trading partners on Wednesday, which he has called “Liberation Day.” Trump also plans to impose a 25% tariff on all non-U.S.-made cars this week.
Asked about the reciprocal tariffs and which countries would be affected, Leavitt declined to provide details. Asked whether lower tariffs would be applied to products used by U.S. farmers, Leavitt said “there are no exemptions at this time.”
Trump also said on Sunday that he would impose secondary tariffs of 25% to 50% on buyers of Russian oil if he determines Russia is trying to thwart U.S. efforts to end the war in Ukraine.
Gold Technical Outlook
XAUUSD
4 days of soaring, gold is heading for its fourth consecutive strong day as it breaks the target at the 0.618% Fibonacci extension of $3,139, followed by the target at the 0.786% Fibonacci extension of $3,177.
With the current technical conditions, there is no resistance or signal for a significant technical correction.
With the medium-term trend being highlighted by the price channel (a) and a blue price channel as the short-term trend. As long as gold remains above the EMA21, it will remain technically bullish in the long-term.
Meanwhile, the Relative Strength Index (RSI) is operating in the overbought zone but is not giving any signal for a possible correction to the downside.
For the day, the technical outlook for gold remains bullish, and any current pullback should be viewed as a short-term correction or a buying opportunity. With that, the notable positions for the uptrend are listed as follows.
Support: 3,139 – 3,128 – 3,113 USD
Resistance: 3,177 USD
This is the end of the article, wishing you a productive and happy working day

APPLEit makes symmetrical triangle pattern is penetreted 233$ target 270$ stop 212$
and is making deep crab pattern entry point 230$ first target 256$ second target 262$
stop loss 212$

The bull and bear case for todayThe market needs to make a decision to either follow through or trap last minute bulls from yesterday.

APPL: Bu/Backtest, and further drop!APPL: Bu/Backtest, and further drop!
-Distribution range, already breakingout the support.
-Backtest/ SOS with low demand volume.
.
See more plans at US STOCKS- WALL STREET DREAM

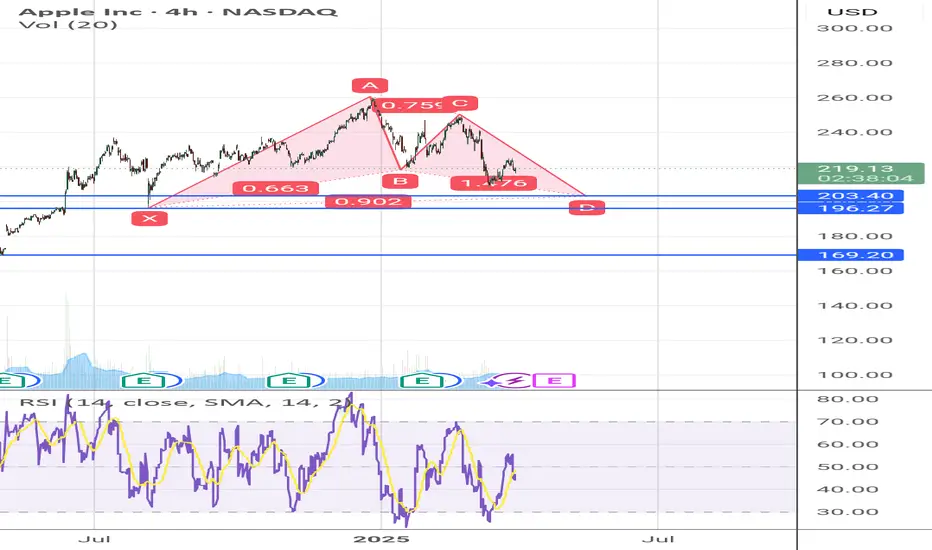
Long APPL between 196-205A bat pattern forming at 0.886 price at 203 at point D.
Pricing goes lower than 196 below point X, would invalidate the pattern.
The support of 196 is the previous resistance, which is why I see this pattern will soon test this points and a buy call might be realises.
Otherwise next support @ 169 would be the extreme for next buy call.
AAPL Breaks Structure! Will the 215 Level Hold or Crack Further?🧠 Smart Money Technical Analysis (1H Chart)
* Market Structure: AAPL recently broke its bullish trendline and confirmed CHoCH (Change of Character) twice, followed by a clear Break of Structure (BOS) on the 1H timeframe. Price is now in a minor bearish trend.
* Rejection Zone: Strong sell pressure came from the $225–$228 supply zone, which aligned with both CHoCH and BOS, acting as confirmation of distribution by smart money.
* Current Price: ~$217.26
Price is hovering just above the red support zone (~$215) — a key level. A breakdown here would suggest acceleration of the bearish move.
* Indicators:
* MACD: Bearish crossover and momentum pushing down, though histogram is flattening — potential loss of downside momentum.
* Stochastic RSI: Oversold, indicating a possible bounce, but not yet confirmed.
📊 Options GEX & Flow Analysis
* GEX Map:
* Gamma Resistance sits at $225–$228, aligned with Smart Money’s CHoCH zone.
* GEX Walls:
* 2nd CALL Wall: $227.5 (34.53%)
* Highest NETGEX: $222.5
* 3rd CALL Wall: $230 (39.67%)
* PUT Support Zones:
* Strongest PUT Wall: $215 (-81.59%)
* Next downside wall: $210 (-60.42%)
* Extreme Support: $200 (-21.37%)
* Options Oscillator:
* IVR: 54.3 — moderately elevated.
* IVx Avg: 38.4
* PUT$ Flow: 20% dominance, leaning bearish.
* Sentiment Lights: 🔴🔴🟢 — Bearish Bias with Caution
⚔️ Scenarios & Trading Ideas
🟢 Bullish Scenario (Low Probability)
* If $215 holds as support and MACD reverses:
* Entry: Above $218.50
* Target 1: $222.5 (Gamma magnet)
* Target 2: $225–$228 (Supply + GEX cluster)
* Stop: Below $214.50
🔴 Bearish Scenario (Preferred Bias)
* Break and close below $215 support opens downside:
* Entry: Under $214.50
* Target 1: $210 (Put Wall)
* Target 2: $205 / $200 (Deep put walls)
* Stop: Above $218
🔍 Summary
AAPL is currently sitting at a pivotal level ($215), with bearish momentum taking hold. If it loses this level, expect a slide toward $210 and possibly deeper. GEX positioning supports downside flow, while SMC shows supply zones were defended. Watch closely for any bounce or breakdown confirmation — this is a trader’s edge zone.
Disclaimer: This analysis is for educational purposes only and does not constitute financial advice. Always conduct your own research and manage risk appropriately.

Tecnical level for new buy entry is 185Not yet time to go heavy longs on Apple....If you wanna go heavy longs, 180-185 would be a safe level...If the channel breaks, then all hands in the air for a mega diarrhea fall.....I hope it doesn't come to that but....It looks like Wyckoff distribution at the moment for Apple....For very long term investors, buy some with every 10% dip.....

AAPL Further DownsideGreen IV correction is in its final stages, and I still expect further lows for green V / blue C.
My first downside target is still gray resistance n the 195-200 zone.

