AAPL.USD trade ideas

Downtrend Forming in Apple?Apple held up better than many large technology stocks last week, but traders may still see downside risk in the smartphone giant.
The first pattern on today’s chart is a potential falling channel since December 26. Continuation of that trend may point toward new lows under $210.
Second, AAPL bottomed at $219.71 in the fourth quarter. The previous quarter’s low was $196. Given weakness in the broader market, could dip-buyers wait for tests of those longer-term levels?
Third, the stock appears to be stalling at its 50- and 100-day simple moving averages. That may reflect a weakening long-term trend.
Next, MACD is falling. The 8-day exponential moving average (EMA) is also at risk of slipping below the 21-day EMA. Those points may reflect weakness in the shorter term.
Finally, AAPL is one of the most active underliers in the options market. (It’s averaged more than 900,000 contracts per day in the last month, according to TradeStation data.) That could make some traders look to position for moves with calls and puts.
TradeStation has, for decades, advanced the trading industry, providing access to stocks, options and futures. If you're born to trade, we could be for you. See our Overview for more.
Past performance, whether actual or indicated by historical tests of strategies, is no guarantee of future performance or success. There is a possibility that you may sustain a loss equal to or greater than your entire investment regardless of which asset class you trade (equities, options or futures); therefore, you should not invest or risk money that you cannot afford to lose. Online trading is not suitable for all investors. View the document titled Characteristics and Risks of Standardized Options at www.TradeStation.com . Before trading any asset class, customers must read the relevant risk disclosure statements on www.TradeStation.com . System access and trade placement and execution may be delayed or fail due to market volatility and volume, quote delays, system and software errors, Internet traffic, outages and other factors.
Securities and futures trading is offered to self-directed customers by TradeStation Securities, Inc., a broker-dealer registered with the Securities and Exchange Commission and a futures commission merchant licensed with the Commodity Futures Trading Commission). TradeStation Securities is a member of the Financial Industry Regulatory Authority, the National Futures Association, and a number of exchanges.
Options trading is not suitable for all investors. Your TradeStation Securities’ account application to trade options will be considered and approved or disapproved based on all relevant factors, including your trading experience. See www.TradeStation.com . Visit www.TradeStation.com for full details on the costs and fees associated with options.
Margin trading involves risks, and it is important that you fully understand those risks before trading on margin. The Margin Disclosure Statement outlines many of those risks, including that you can lose more funds than you deposit in your margin account; your brokerage firm can force the sale of securities in your account; your brokerage firm can sell your securities without contacting you; and you are not entitled to an extension of time on a margin call. Review the Margin Disclosure Statement at www.TradeStation.com .
TradeStation Securities, Inc. and TradeStation Technologies, Inc. are each wholly owned subsidiaries of TradeStation Group, Inc., both operating, and providing products and services, under the TradeStation brand and trademark. When applying for, or purchasing, accounts, subscriptions, products and services, it is important that you know which company you will be dealing with. Visit www.TradeStation.com for further important information explaining what this means.

AAPL Approaching Key Levels – Will This Uptrend Hold?Technical Analysis (TA) for Trading:
* Current Price Action: AAPL is trading around $238.54, showing a strong rebound from the prior reversal zone near $229 - $234. It has broken out of a descending trendline and is now consolidating near $239, a key resistance level.
* Support Levels:
* $234.02 – Key support aligned with prior rejection zones.
* $229.20 – Strong demand zone where buyers stepped in previously.
* Resistance Levels:
* $244.02 – Immediate resistance where price previously struggled.
* $251.08 – Higher resistance, aligning with historical price action.
* Indicators:
* MACD: Bullish momentum but showing slight exhaustion.
* Stochastic RSI: High but beginning to cool off, suggesting consolidation before a breakout or pullback.
* Volume: Increased buying pressure supports the breakout but needs continuation to sustain.
* Price Outlook:
* If AAPL holds above $238, it can attempt a move toward $244 - $250.
* A drop below $234 could lead to further downside toward $229.
GEX & Options Analysis for Trading:
* Gamma Exposure (GEX) Insights:
* Highest Positive GEX / Call Resistance: $250 – A significant resistance zone where call positions may slow the uptrend.
* 2nd Call Wall: $260 – Additional call resistance if momentum sustains.
* Put Support at $225 – Major downside support from options positioning.
* Additional Put Walls at $220 and $230 – Lower levels that could trigger dealer hedging if broken.
* IV & Market Sentiment:
* IV Rank (IVR): 57.3 – Moderate volatility, making options reasonably priced.
* IVx Avg: 37.6, showing a slightly lower-than-average implied volatility.
* Options Sentiment: Puts at 18.6%, suggesting bullish sentiment overall.
Trading Strategy:
* Bullish Scenario:
* Entry near $238 - $240 with a target at $244 - $250.
* Stop-loss at $234.
* Bearish Scenario:
* If rejected at $240, a short position targeting $234 - $230 with a stop at $242.
Final Thoughts:
AAPL is holding a bullish structure after breaking out of a key trendline, but it needs to clear $244 to confirm a continuation. Options data suggests $250 is a critical gamma resistance. Watch for volume and momentum signals to confirm direction.
Disclaimer: This analysis is for educational purposes only and not financial advice. Always do your own research before trading.

APPL 2X downI see 2 potential moves to the downside.
From a good resistance at $240 moving down to the $226/227 area where there is a weaker support.
From that movement on I believe that it will either move up to retest previous resistance and if it fails. t will move towards the $214/216 area in order to reach the order block.
This week will be one interesting and very volatile for sure.

Massive rising wedge If you see a massive rising wedge you are correct. In my opinion this is either complete or finishing up in the next couple days. Either way we are about to have a drop. Be cautious and like always this is just my opinion.
Short Term Up For Apple. AAPLBetting on a triple drive formation here, while stock price is correcting from the last drop. None of the technical indicators have turned, yet, although they appear to be about to. This is a discretionary idea with increased risk, as there is no signal until an indicator produces one.

Lunar Signal Generator My Lunar signal generator uses a sinusoidal wave which is matched in frequency to the sinusoidal motion of the moon. The indicator is based on research which suggests that there are increased returns on days surrounding the new moon and decreased returns on days surrounding the full moon.
The indicator represents a two week trading strategy and prints buy signals before the new moon, and prints sell signals on the full moon. If used as a trading strategy the 5 & 10 year win rates are 70%, profitability is dependent on your choice of stoploss. I suggest a 9% Stoploss however this is discretionary. Can be used on any financial product, however it works best on large cap equities.
Just place on any chart, and trade according to the buy and sell signals
Check out my website, (press the little globe below my profile description)
Please reach out for any questions/concerns

Risk On And Money Rotating?There is a lot of indication that risk could be back on in greater markets. Tech is still very weak but, I think there is a possibility that money is rotating out of tech and into other sectors. I talked about healthcare, some utilities and minerals in other videos.

AAPL Reversal Zone & Trade SetupReversal Zone Explanation
* AAPL has recently bounced off a demand zone around $230-$232, aligning with the highest negative NETGEX/PUT Support.
* If buyers sustain momentum above $236-$240, we could see a push towards resistance levels near $245-$250.
* On the downside, a break below $230 could trigger further declines toward $225-$220, where the next major support lies.
My Thoughts
* The stock has shown early signs of a short-term reversal after forming a Break of Structure (BOS).
* The MACD is turning bullish with a potential crossover, supporting further upside.
* Stochastic RSI is climbing from oversold conditions, indicating momentum could continue higher.
Suggested Trade
Bullish Case
* Entry: $236-$238 (on confirmation of strength)
* Target 1: $245
* Target 2: $250
* Stop-loss: Below $230
Bearish Case (if rejected at $240-$245)
* Entry: $240-$242
* Target 1: $232
* Target 2: $225
* Stop-loss: Above $246
Options Recommendation
* Call Option (Bullish Setup)
* Strike: $240
* Expiration: March 15
* Type: ITM/ATM Call
* Rationale: Strong bounce from support and bullish momentum confirmation.
* Put Option (Bearish Setup)
* Strike: $230
* Expiration: March 15
* Type: ITM/ATM Put
* Rationale: If price fails to hold above $240 and breaks below $230, puts could gain value.
Disclaimer
This analysis is for educational purposes only and does not constitute financial advice. Trading stocks and options involves risk, and you should conduct your own research before making any investment decisions.

APPLE- bear spread because Grandpa Buffett is taking profitsApple has 33 PE but is growing 8-10% per year and just laid off people because of potential TRUMP tariff issues.
RSI is high enough me to take a bear put spread on. credit call spread should work just as well.
any deep dips in apple below the 200 moving averages are worth buying in my opnion with unlevered shares.
analysts expect apple to earn 20.85 by 2031, and will make apple worth 400-500 in future.
but for now, its worth a bear spread for me. market is looking like a sellers market in short term. if Im wrong, i have defined risk by using the spread.

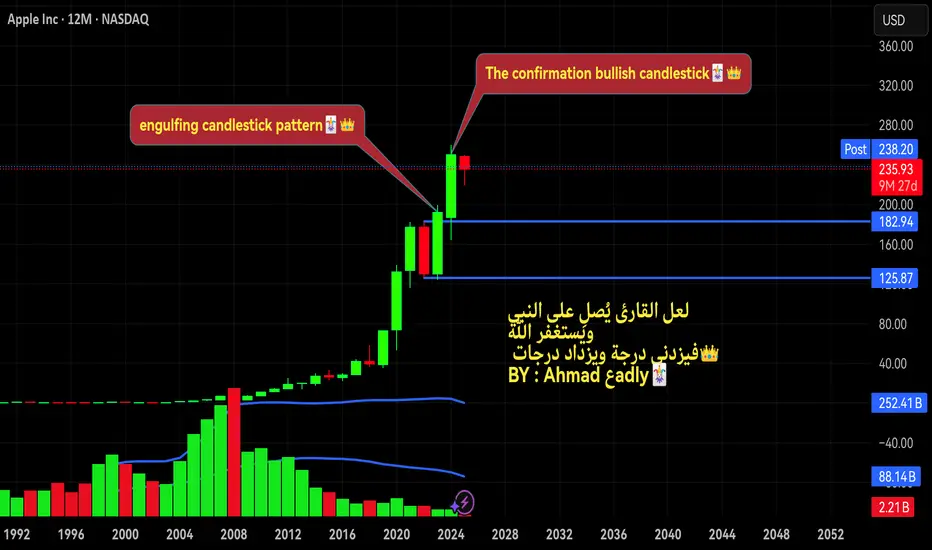
Apple long position I see engulfing candlestick pattern & The confirmation bullish candlestick
It's a good signal for long position
Good luck 4 all🃏👑
Make a Move: Bullish on Apple for Next Week
- Key Insights: Investors should look to accumulate shares of Apple as the
market sentiment is optimistic, driven by recent strategic investments in AI
and domestic production. Given the stock's resilience and bullish
indicators, a gradual investment strategy could maximize potential gains as
the company continues to navigate through a favorable technological
landscape.
- Price Targets: Next week targets are set with T1 at 243 and T2 at 250,
focusing on the potential upward movement aligned with established
resistance levels. Stop levels should be set at S1 of 237 and S2 of 235 to
protect against any unforeseen downward shifts in price.
- Recent Performance: Apple has showcased robust resilience recently,
experiencing a 2% gain amidst a tech sector rally. The stock remains above
critical support levels, which further strengthens its bullish outlook,
especially as the sector recovers.
- Expert Analysis: Analysts like James Demmer project a positive outlook for
Apple, particularly due to its $500 billion investment in AI and domestic
production in Texas. This signifies a strategic positioning within the
evolving tech landscape, further supported by expert recommendations for a
staged accumulation of shares to capitalize on growth.
- News Impact: Apple's push for increased iPhone production in India and its
substantial investment in AI development are notable developments that
reflect an adaptive strategy amid shifting global dynamics. This focus on
technology and employment generation is likely to enhance its market
valuation and innovation capabilities moving forward.
AAPL at a Critical Level! Key Trade Setups for This Week. Mar.3Technical Analysis (TA) - Trading Perspective
Apple Inc. (AAPL) has been trading in a downward channel, recently testing a key reversal zone around $242.50. The stock has broken out of the descending wedge pattern and is now at a decision point:
Support Levels:
$240 – Major support, aligned with the recent price action.
$230 – Key downside level, a break here could trigger further selling.
Resistance Levels:
$250 – Major resistance & reversal zone, aligned with the call gamma wall.
$255–$260 – Further bullish targets if momentum sustains.
Indicators:
MACD: Turning positive, signaling momentum shift.
Stochastic RSI: Overbought zone, indicating a potential pullback.
Volume Profile: Strong resistance around $242.50, with buyers stepping in.
GEX & Options Trading Perspective
Gamma Exposure (GEX) suggests that options positioning could influence price action significantly:
Highest Positive NetGEX / Call Resistance: $250 – This level is critical resistance where price could slow down.
2nd & 3rd Call Walls: $255 & $260 – If AAPL breaks above $250, gamma-driven buying could push it toward these levels.
Put Wall Support: $240 – This is the main support area based on put positioning.
IV Rank (IVR): 46.6 – Moderate volatility, suggesting decent options pricing.
Sentiment: Puts 17% – Slightly bearish, but positioning suggests a possible squeeze.
Trade Scenarios
Bullish Play:
Entry above $243 with a target of $250-$255.
Stop-loss below $240 to minimize risk.
Bearish Play:
Short position below $240 with a target of $230-$225.
Stop-loss above $243.
Conclusion & Suggestions
AAPL is at a key decision point. A clean breakout above $242.50 could trigger a gamma squeeze toward $250+, while rejection here might bring it back to $230 support. Watch volume and price action at these levels carefully.
📌 This analysis is for educational purposes only and does not constitute financial advice. Always conduct your own research before trading. 🚀


Apple (AAPL) Weekly Update : Ascending Channel
The AAPL chart shows a clear ascending channel, indicating a long-term uptrend with oscillations between support and resistance levels.
Bullish Case
Ascending Channel:
Price is moving within a well-defined ascending channel.
The lower trendline (~$210) acted as strong support during recent pullbacks, confirming the trend's integrity.
Indicators:
RSI: At ~55.81, it suggests room for further upside without being overbought.
Ichimoku Cloud: Price remains above the cloud, signaling bullish momentum.
Upside Target:
If AAPL continues its upward trajectory within the channel, resistance near $260–$270 becomes the next target.

Missed the run last week.I don't follow AAPL much, so I didn't see the entry last week when the price crossed and closed above the Bollinger Band midline.
So, after last week's run, I am waiting for a pullback and rest before entering long with some call options.
I'll keep watching and updating as the price unfolds.

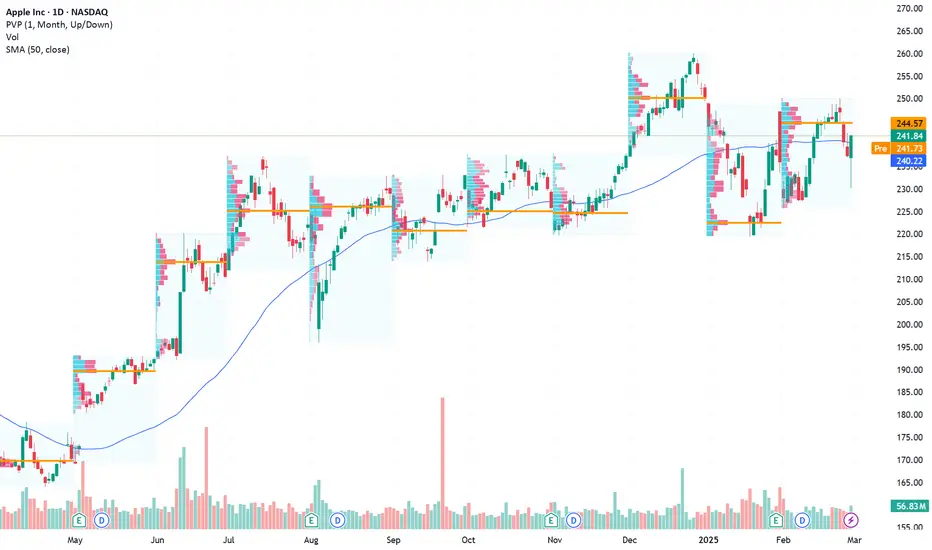
AAPL Trade PlanHere’s a potential trade setup for AAPL based on key levels:
📌 Entry Points: 229 / 219 / 208 (Scaling in)
🎯 Profit Targets: 236 / 243 / 256 (Scaling out)
💡 Strategy:
If AAPL holds above 229, consider entering with a first position.
If it drops to 219, it could be a good second entry.
A dip to 208 might be a strong buy zone.
Take profits gradually at 236, 243, and 256 to lock in gains.
🚨 Disclaimer: This is not financial advice. Always do your own research and trade responsibly! 📊✨
What do you think? 🚀

Apple - Bull vs. Bear CaseCurrent Price: $241.84
Resistance Levels: 241.91, 259.81 (High)
Support Levels: 230.48, 219.68, 207.42
Trendline: Holding for now, but if broken, price could drop significantly.
Bullish Case
Trendline Support Holding
Price is still above the rising trendline, acting as strong support.
RSI (~52.63): Neutral but recovering.
Stochastic (~64.21): Turning up, suggesting potential upside momentum.
AAPL is still above the key EMAs, which supports a bullish case.
Volume Profile Shows Strong Demand Above 230
Buyers stepping in around $230-$238, preventing deeper pullbacks.
Bullish Target Levels
Break above 241 → Re-test 259.81 (All-time high)
If 259.81 breaks → Next leg higher (~270-275 possible)
Bearish Case
Trendline Breakdown Could Trigger a Decline
A break below $230.48 will confirm a bearish breakdown.
RSI is not in strong bullish territory yet.
Bearish Targets from Volume Profile
If $230 breaks, price may move towards:
$219.68 (First strong support)
$207.42 (Next key level)
$191.27 (Major demand zone)
Bearish Target Levels
Break below 230 → Move to 219 first
Below 219 → Risk of deeper pullback to 207-200 range
Final Outlook: Leaning Bullish if price breaks above $245
As long as $230 holds, AAPL remains bullish
Break below $230. Then expect a move toward $219 and possibly lower.
Strategy
Bullish Above 245 → Target 250-259
Bearish Below 230 → Target 219,207, 195

$AAPL - trendline support held and making a strong bounceNASDAQ:AAPL - stock held $240 trend line support the end of the day. Stock strong in a downtrend market. Stock has top of the trend-line at $255. Swing calls added in the group. Looking for $250 plus as long as $240 holds

APPLE Buyers In Panic! SELL!
My dear followers,
This is my opinion on the APPLE next move:
The asset is approaching an important pivot point 245.60
Bias - Bearish
Safe Stop Loss - 251.37
Technical Indicators: Supper Trend generates a clear short signal while Pivot Point HL is currently determining the overall Bearish trend of the market.
Goal - 235.33
About Used Indicators:
For more efficient signals, super-trend is used in combination with other indicators like Pivot Points.
———————————
WISH YOU ALL LUCK

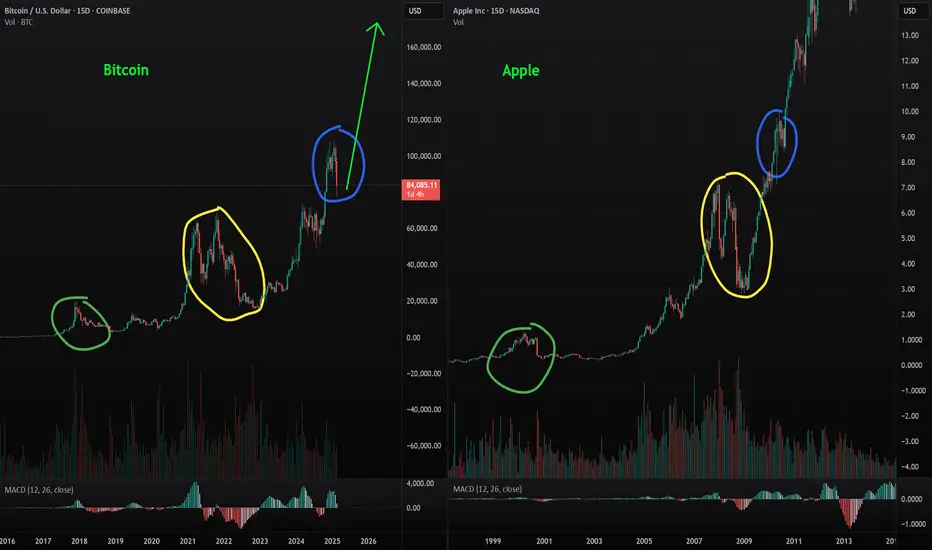
Don't lose sight of what is about to happen with Bitcoin.Bitcoin will blow investors away. Be ready for an expansion that most investors are simply not anticipating. This growth could be massive. Please don't lose sight of what’s coming.
Stay profitable.
– Dalin Anderson
AAPL Bear FlagDivergence on the high, no divergence on the low. Impulsive movement to the downside, correction to the upside inside a channel.
You don't get much more bearflagish than this.
But we're still inside the channel.. let's see how this plays out.

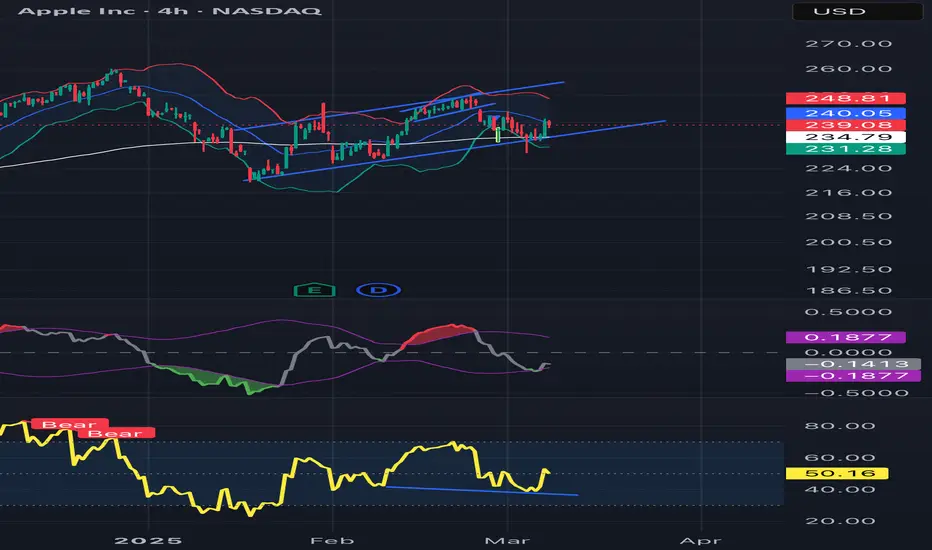
AAPL Holding Key Support! Will Bulls Step In at $239? Technical Analysis for February 27, 2025:
1. Current Price Action:
* AAPL dropped sharply and found support near $239, now consolidating in a tight range.
* A falling wedge pattern is forming, suggesting a potential reversal.
* The Point of Control (POC) at $241.52 is a critical level to reclaim for upside continuation.
2. Key Levels to Watch:
* Support: $239 (Current low), $237.50 (Next major downside level).
* Resistance: $241.50-$245 (POC and major resistance), $250 (Critical breakout level).
* Upside Targets: $245, $250, $255.
3. Indicators Analysis:
* MACD: Bearish but flattening out, suggesting downside momentum may be weakening.
* Stoch RSI: Deeply oversold, indicating potential for a bounce.
* Volume Profile: Heavy resistance at $241-$245; a strong move above this level could trigger upside momentum.
GEX & Option Strategy for Tomorrow and the Week:
1. Gamma Exposure (GEX) Insights:
* Call Walls: $250, $255 → Major resistance zones.
* Put Walls: $237.50, $235 → Downside risk areas.
2. IV & Sentiment:
* IVR: 45 (Moderate)
* IVx Avg: 30.5 (Low volatility)
* Put Positioning: 14.7% bearish sentiment (Put-heavy).
* GEX Sentiment: Currently negative; if AAPL stays above $239-$241, sentiment could shift bullish.
3. Trading Suggestions:
* Bullish Setup: If AAPL reclaims $241-$245, consider long positions targeting $250-$255, with a stop at $238.
* Bearish Setup: If AAPL rejects $241.50, short setups targeting $237.50-$235, stop at $243.
* Options Play: Selling put spreads at $237 support or call spreads near $250 resistance.
📌 My Thoughts & Suggestion:
* AAPL is at a critical inflection point—holding $239-$240 could lead to a reversal toward $245-$250.
* If the stock fails to hold $239, expect a test of $237-$235.
* Low volatility makes long options attractive, especially for a directional bet.
⚠️ Disclaimer:
This analysis is for educational purposes only and does not constitute financial advice. Always do your own research and manage your risk before trading. 🚀
