Meta's Q3 Financial Results | Growth and the Future of AI & AR Meta's Q3 Earnings: AI Investments Shape the Future of Engagement and Monetization
Last week, Meta shared its Q3 earnings, revealing a familiar trend: while the results were strong, rising AI investments cast a shadow. With over 3.2 billion daily users across Meta’s apps, the company alongside Google and YouTube is in a prime position to bring AI into the mainstream. However, this shift could potentially disrupt the creator economy as we know it
So, how will this affect the future of Meta’s apps?
Did you know META is 222% up since our first analysis ?
Let’s break down the quarter and explore the latest updates
Today’s Highlights
- Overview of Meta Q3 FY24
- Recent business highlights
- Key quotes from the earnings call
- The potential decline of the creator economy
1. Meta Q3 FY24 Overview
Meta operates within two main segments
FoA: Family of Apps (Facebook, Instagram, Messenger, and WhatsApp)
RL: Reality Labs (virtual reality hardware and software)
Daily Active People in FoA grew by 5% year over year, reaching 3.29 billion. However, user growth has slowed, with Meta adding 20 million daily users in Q3 2024 down from 50 million earlier in 2024.
Meta’s reach now extends to over half of the global population aged 15 to 80, meaning future growth will hinge more on engagement and ad efficiency than adding new users.
Key Insights from Zuckerberg:
-Facebook: Positive engagement trends among Gen Z in the U.S.
-Instagram: Sustains “strong” growth globally.
-WhatsApp: Now surpasses 2 billion calls daily.
-Meta AI: 500 million monthly active users.
-Threads: 275 million monthly active users, up from 200 million in Q2, with notable growth in regions like the U.S., Taiwan, and Japan (currently not monetized and unlikely to drive significant revenue by 2025).
Advertising Performance:
- Ad impressions grew 7% year-over-year (compared to 10% in Q2).
- Average ad price increased by 11% year-over-year (10% in Q2).
- Average revenue per user grew by 12% year-over-year, reaching $12.29 (compared to Snap at $3.10 and Reddit at $3.58).
- Despite some critics suggesting potential inflation due to bot activity, ARPU growth points to real ad value; fake users can’t generate revenue.
Financials
- Revenue rose 19% year-over-year to $40.6 billion.
- FoA saw a 19% increase, reaching $40.3 billion.
- RL grew by 29% to $0.3 billion.
- Gross margin was 82% (-1pp Y/Y, +1pp Q/Q).
- Operating margin stood at 43% (+2pp Y/Y, +5pp Q/Q).
- FoA operating profit was $21.8 billion (54% margin, +2pp Y/Y).
- RL reported an operating loss of $4.4 billion (down slightly from $4.5 billion in Q2).
- EPS rose by 37% year-over-year to $6.03.
Cash Flow
- Operating cash flow was $24.7 billion (61% margin, +1pp Y/Y).
- Free cash flow was $15.5 billion (38% margin, -2pp Y/Y).
Balance Sheet
- Cash and marketable securities totaled $71 billion
- Long-term debt was $29 billion
Guidance:
- Q4 FY24 revenue is forecasted at $46.5 billion in the mid-range
- FY24 expenses estimated at $96-$98 billion (previously $96-$99 billion)
- FY24 Capex is expected to be $38-40 billion (previously $37-$40 billion)
Summary Analysis
Revenue growth was 20% in constant currency (compared to 23% in Q2), with ad revenue growth driven by increased ad prices. Strong demand for ads continued, largely due to higher ad performance, especially in online commerce, healthcare, and entertainment. Geographically, North America and Europe led growth at 21%, while Asia slowed from 28% to 15%.
Reality Labs’ revenue rose 29%, mainly from hardware sales, though the division continues to post significant losses. As shown in the visuals, FoA operating profit reached an all-time high, while RL’s losses remain around $4 billion quarterly.
Headcount increased by 9% year-over-year to 72,404, signaling a return to hiring, particularly in priority areas such as monetization, infrastructure, Reality Labs, and generative AI.
Stock buybacks amounted to nearly $9 billion in Q3, up from $6 billion in Q2, though lower than the $15 billion in Q1. Management’s confidence in Meta’s stock remains strong, with an additional $1.3 billion paid in dividends.
Capital expenditures climbed by 36% to $9.2 billion compared to $8.5 billion in Q2, with guidance staying on track. Management anticipates “significant acceleration in infrastructure expenses” for 2025, which will affect both the cost of revenue and R&D expenses.
Despite heavy AI spending, Meta remains highly profitable, generating nearly $52 billion in free cash flow over the past 12 months—just shy of Alphabet’s $56 billion over the same period.
Q4 FY24 revenue guidance points to deceleration, with mid-range growth forecasted at 16%.
Let’s examine Meta’s investments and market position further.
2. Recent Business Highlights
Meta Orion
Meta's Orion AR glasses mark an ambitious step towards a future beyond smartphones, showcasing the potential of augmented reality (AR):
-Prototype Status: Orion is a high-tech AR prototype, equipped with advanced features, but high production costs keep it out of reach for consumers.
-Advanced AR Display: Using Micro LED projectors and silicon carbide lenses, Orion offers a broad field of view with sharper visuals than most current AR devices.
-Interactive AI Integration: With Meta's generative AI, Orion enables users to interact with virtual elements, identify real-world objects, and create immediate solutions, such as recipes.
-Complex Hardware: Orion relies on a neural wristband for control and a wireless compute puck, creating a multi-part system.
-High Cost & Limited Production: With a price tag estimated at $10,000, Orion isn’t ready for mass production. Meta has produced around 1,000 units for demonstrations and internal testing.
- Future Vision: Meta aims to release a consumer-friendly AR device within a few years, working toward a slimmer, more affordable model that could rival smartphone prices.
Orion reflects Meta's goal to lead the next wave of computing, though significant technological and cost hurdles remain.
Timing and Competitive Landscape**: Zuckerberg’s reveal of Orion may aim to justify Reality Labs' annual $16-20 billion operating loss to shareholders and gather feedback. Meanwhile, Apple has initiated its “Atlas” project to explore the smart glasses market, indicating potential plans to shift focus from the high-end $3,500 Vision Pro VR headset.
How AI Is Already Impacting Meta
Beyond future-oriented projects like Orion, Meta’s AI advancements are actively enhancing its core business in two strategic areas: engagement and monetization.
-Engagement: Meta's recommendation engine uses AI to tailor feeds with highly relevant video content, keeping users engaged. AI-driven prediction systems further increase app usage by showing content that maximizes interaction.
-Monetization: AI boosts ad efficiency across the entire lifecycle—from creation to performance tracking. Generative AI assists with ad copy, images, and video, while advanced models analyze user behavior to serve targeted ads, improving conversion rates incrementally.
-Meta AI Studio: This platform allows developers to create, train, and deploy custom AI models within Meta’s ecosystem. By enabling personalized assistants, interactive AI, and AR applications, Meta seeks to drive new consumer apps and maximize ad potential across its platforms.
Market Share
Meta’s advertising revenue hit $39.9 billion in Q3, reaching 81% of Google’s search revenue, up from 76% last year. Meta’s ad revenue is expanding at the same rate as Amazon’s, despite Meta’s larger base, signaling regained market share and effective adaptation to the post-ATT environment.
3. Key Quotes from the Earnings Call
CEO Mark Zuckerberg
- On AI and the Family of Apps: “Improvements to our AI-driven feed and video recommendations have led to an 8% increase in time spent on Facebook and a 6% increase on Instagram this year alone. More than a million advertisers used our GenAI tools to create over 15 million ads last month, and we estimate businesses using Image Generation are seeing a 7% conversion lift.”
-On Llama 4: “We're training the Llama 4 models on a cluster larger than 100,000 H100s, more extensive than anything reported elsewhere.”
-On RayBan Meta Glasses: “Glasses are the ideal AI form factor as they let your AI see, hear, and communicate with you. Demand remains strong, with the new clear edition selling out quickly.”
-On Meta AI: “We’re on track for Meta AI to become the world’s most used AI assistant by year-end, with popular uses including information gathering, task assistance, and content exploration.”
CFO Susan Li
-On Recommendations: “Inspired by scaling laws observed in large language models, we’ve developed new ranking architectures for Facebook video that enhance relevance and increase watch time”
-On Capital Allocation: “We’re optimistic about our opportunities and believe that investing now in infrastructure and talent will accelerate progress and returns.”
4. The Potential Decline of the Creator Economy
Facebook and Instagram have evolved from social networks to content networks, benefiting creators with wide-reaching platforms. However, this era may be coming to a close.
-AI-Generated Content: Zuckerberg shared plans to introduce AI-generated and AI-summarized content on Facebook, Instagram, and potentially Threads, gradually shifting away from creator-generated content as the primary engagement driver.
-Impact on Creators: As AI learns to identify and generate engaging content, creators could struggle to compete, with algorithms delivering exactly what audiences want. Over time, creators may face a landscape where AI determines the most engaging posts, relegating them to the sidelines in a world increasingly powered by self-generating content.
-Why It Matters: Platforms like YouTube share 55% of ad revenue with creators, but Meta does not, meaning that an AI-driven shift isn’t primarily about cost-cutting. Instead, it allows for more integrated ad placements within algorithmic feeds, potentially boosting impressions and conversions.
Although AI generated feeds may sound dystopian, current high engagement accounts already use tactics to maximize engagement, meaning the shift to AI might go largely unnoticed by audiences.
FB trade ideas

New indicator: Earnings Expansion ProjectionNothing like this is available on TradingView so I decided to build it

META: trend structure is approaching important resistance zoneMeta is approaching important resistance zone both in terms of macro (from 2022 lows) and mid-term (since Apr 2024 lows): 700-760 level.
Until price is bellow 760 level, my operative scenario is to prepare for at least mid-term topping action with following unfold of larger correction. Macro support levels for this potential correction are at 520-420.
From the long-term investing perspective it looks reasonable to consider hedging long-term holdings. From swing-trading perspective this resistance levels might present good risk-reward opportunity in coming weeks.
From macro-perspective, levels of 520-420 are important zone to watch for future supporting action if mid-term correction materializes.
Until price is holding above 420, macro uptrend since 2022 lows looks intact and assumes higher levels (at 1000-1300 macro resistance) in years to come.
As an alternative mid-term scenario, I might also consider price trying to reach higher resistance levels, around 800-810, before starting larger degree correction towards macro support zone.
If price moves beyond 810 level and will be able to sustain further advance afterwards, or in macro-perspective: fall below 420 level, suggested mid-term and macro structures needs to be revised.
Thank you for your attention and wishing the best to your investing and trading in 2025!

Change in Direction for META? Hello traders,
After reviewing the overall market and running some technicals on META, I think we're due for a bit of downside towards the midpoint in this parallel channel around 637.40.
But why?
Well, TikTok is back as we all know and that joke of a ban only added growth to the companies platform. That's the headline for this one. Next up, we have technical analysis.
On the 4H chart, RSI has topped off and MACD started to turn. Normally, the MACD being above the zero line would not be reason enough, but seeing the candles outside the Bollinger Band has made me think otherwise.
The Bollinger Bands have a set law that the price MUST come back into the zone. It has no set path, but it has to enter back into the zone, giving us a small range of price action, usually down or sideways, to enter back in the zone. (I have my BB set to 100day MA)
Let's see what happens in the next upcoming 2-3 weeks and also keep an eye on the premium cost for the options in relevance to what target price we have.
Thanks for reading.

METAMETA closed the week on weekly rejection to supply roof ,the impulse will push the stocks lower zone seeking demand ,i will be watching the 666.89 demand floor on confluence and on timing will buy into meta stocks.

META Buy SetupMETA Buy Setup
Our latest buy position on META targets 703.60, with a projected timeline until Feb 3, 2025. Price is holding near 686.72, and a boost from current levels could trigger a solid upward move.
Replay the entire trade on TradingView to see every entry and exit. Remember to apply proper risk management and monitor the chart closely.
#META #BuyEntry #TechnicalAnalysis #TradingStrategy

META - Technical Analysis and GEX InsightsTechnical Analysis:
* Price Action: META is consolidating between the key resistance at $716.17 and support at $676.49. A breakout above the resistance level could indicate further upside momentum, while a breakdown below $676.49 might signal a bearish shift.
* Trend Analysis: The stock has been maintaining an uptrend channel, supported by ascending trendlines. However, the current sideways movement suggests a pause in momentum.
* Indicators:
* MACD: Indicates a slight bearish crossover, signaling potential short-term weakness.
* Stochastic RSI: Currently oversold, hinting at a possible bounce or retracement in the near term.
* Volume: Diminished activity during consolidation phases reflects indecision among traders.
GEX and Options Analysis:
* Call Wall: Strong resistance at $700 (30.67%) and $716 (highest positive GEX and gamma wall).
* Put Wall: Key support levels are at $600 and $585, with $600 being the highest negative GEX/put support.
* IVR and IVx: IVR at 13.7 and IVx average at 33.9, indicating relatively low implied volatility compared to its historical range.
* Options Sentiment: Call positioning at 29.3%, with a bearish tone as puts dominate the sentiment.
Trading Plan:
1. Bullish Scenario:
* Entry: Above $716.20 with confirmation.
* Targets: $730, $740, and $750.
* Stop-Loss: Below $705.
2. Bearish Scenario:
* Entry: Below $676.
* Targets: $660, $645, and $630.
* Stop-Loss: Above $690.
Option Trade Suggestions:
1. Bullish Setup: Buy the $720 call expiring in 2-3 weeks if the price breaks $716 with strong volume.
2. Bearish Setup: Buy the $660 put expiring in 2-3 weeks if the price drops below $676.
Conclusion and Thoughts:
META is currently in a consolidation phase. Traders should watch for a breakout or breakdown from the current range to confirm the next trend direction. The GEX data suggests strong resistance at $700-$716, making it a critical level for bulls to overcome. Conversely, bears need to push the stock below $676 for further downside.
Disclaimer: This analysis is for educational purposes only and not financial advice. Prices and setups are based on the current chart and may change in the premarket. Adjustments are required for real-time data. For questions, please PM me.

Meta Platforms - The Breakout Rally To $1.000!Meta Platforms ( NASDAQ:META ) is about to break out:
Click chart above to see the detailed analysis👆🏻
Ever since Meta Platforms - formerly known as Facebook - was listed on the Nasdaq, this stock has been creating new all time highs over and over again. Also over the past couple of months, momentum was pretty strong and a triangle breakout seems inevitable.
Levels to watch: $650, $1.000
Keep your long term vision,
Philip (BasicTrading)

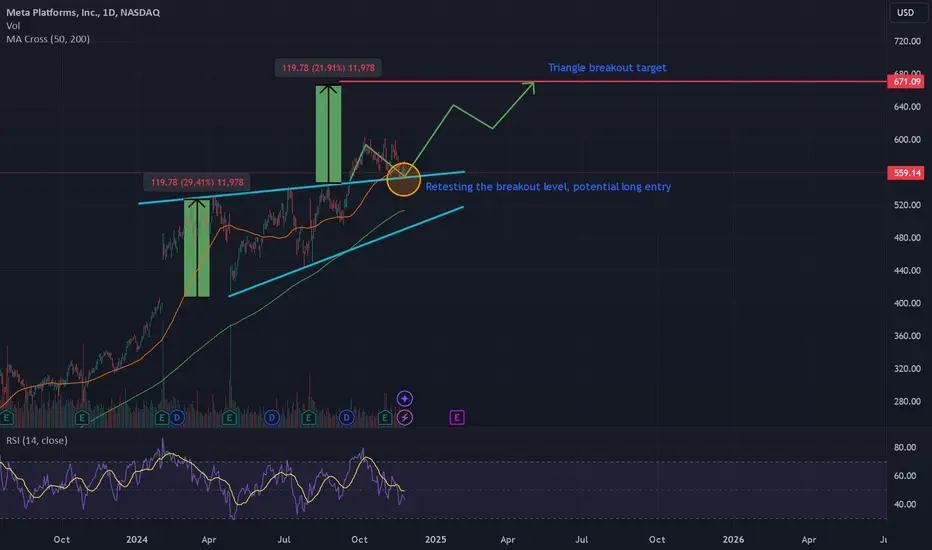
Meta, time to enter?Hi everyone!
Pattern: Meta formed an ascending triangle from Jan 2024 up to Sep 2024 where it broke out of the pattern. Currently retesting the breakout level and has potential for long entry.
Price target: The price target for ascending triangle breakout pattern is the measure of the height of the triangle from its base to the resistance line. Add this to the breakout point and we get the target price of 670$
Caution: If the price fall back to the triangle, this analysis is not valid anymore.

Just In: $META Up 3% Premarket Trading Today After Q4 Beat.In a surprising turn of event, shares of Microsoft fell in Europe on Thursday after it issued a downbeat forecast for its cloud business, while Facebook parent Meta shares ( NASDAQ:META ) rose after beating expectations, as investors scrutinised the companies' spending on artificial intelligence.
Microsoft shares traded down 4.5% on the Frankfurt market, having fallen a similar amount in after-hours trading on Wednesday and finishing the regular session down 1.1%.
Meta shares however, opened up 2.5% in Germany, having risen 2.1% after the closing bell and ending the regular session up 0.3%.
Days after Chinese upstart DeepSeek revealed a breakthrough in cheap AI computing that shook the U.S. technology industry, the chief executives of Microsoft and Meta defended massive spending that they said was key to staying competitive in the new field.
Meta CEO Mark Zuckerberg said Wednesday’s that the rapid rise of competitors from China has only strengthened the tech giant’s commitment to its AI ambitions.
The CEO said it’s too early to know how growing competition from China could impact its future investments. Meta reiterated its forecast of $60 billion to $65 billion in capital expenditures this year.
Technical Outlook
as of the time of writing, NASDAQ:META shares is up 2.81% in Thursday's premarket session. NASDAQ:META closed Wednesday's session with the overbought Relative Strength Index (RSI) of 71.87. however, NASDAQ:META doesnt seem to be cooling off any moment with the shares moving above key MA this only solidifies the fact that NASDAQ:META could bridged the $700 pivot point. However, in the case of a drawback, NASDAQ:META 's should find support in the 38.2% Fibonacci retracement point a level that aligns with the $640 price action.

META at ATHMETA stock at ATH
Our technical analysis was highly respected by META stock.
The $674 zone is now the latest resistance zone.

META - Is a powerhouse, don't miss out!NASDAQ:META - I told you!!! 😘
$705 profit target hit!!!!! 🎯🎯🎯🏹🏹🏹
I was buying that free DIP up and down!
This company is still undervalued and going to $800+ in 2025
They crushed my predictions like they were analysts predictions hahaha
Not financial advice

Mega cap earnings watchMega cap earnings get started today. Here's a comparison chart of META, TSLA, MSFT, AAPL, GOOG & AMZN. With the ticker Tracker MFI oscillator on the 1 day ext chart 3 month view. Below is the list of dates and times of their earnings release.
META 1/29 4:05pm
Consensus
EPS = 6.68
Revenue = 46.98 B
TSLA 1/29 4:05pm
Consensus
EPS = .75
Revenue = 27.61 B
MSFT 1/29 4:05pm
Consensus
EPS = 3.11
Revenue = 68.75 B
AAPL 1/30 4:30pm
Consensus
EPS = 2.36
Revenue = 124.1 B
GOOG 2/4 4:05pm
Consensus
EPS = 2.12
Revenue = 81.38 B
AMZN 2/6 4pm
Consensus
EPS = 1.52
Revenue = 187.13 B

$META Expected move for Earnings todayAlright, y'all... META today. Expected move between 624-723 - a 7.39% implied earnings move. Let's see how this goes!! How are you playing this?

META: Bullish Momentum Holding, but Resistance Must Be Cleared🔥 LucanInvestor's Strategy:
🩸 Short: Below $670, targeting $650. If it breaks below the 9 EMA, downside pressure could accelerate.
🩸 Long: Above $680, targeting $720. A strong breakout continuation would confirm the bullish trend.
🔥 LucanInvestor's Commands:
🩸 Resistance: $680 — Crucial level to maintain for further bullish momentum.
🩸 Support: $653 — Key support zone aligned with the supertrend indicator.
Meta has surged into new highs, supported by an upward MACD crossover and strong volume. Holding above resistance is key for further upside, while losing momentum could trigger a correction.
👑 "The path to dominance is forged through strength and precision."

META price pointsThese are my current price targets for META.
I think it heads down towards $550 this week or next following earnings. Then a larger move down towards $400 in the coming months.

META Platforms Options Ahead of Earnings If you haven`t bought META before the rally:
Now analyzing the options chain and the chart patterns of META Platforms prior to the earnings report this week,
I would consider purchasing the 660usd strike price Calls with
an expiration date of 2025-2-21,
for a premium of approximately $32.20.
If these options prove to be profitable prior to the earnings release, I would sell at least half of them.

US Stocks to Watch This WeekDeepSeek triggered NVidia meltdown forced many investors to Exit NVidia positions and that money is flowing into some other stocks.
Following stocks have surfaced above of the cloud (consolidation zone) as detected by Option Scalper indicator:
1. ABT
2. META
3. WMT
4. V
5. NFLX
6. MA
7. JNJ
8. CRM
9. HD
10. ACN
11. PEP
12. TMO
13. JPM
14. PG
15. COST
16. BRK.A
17. AMZN
18. KO
19. WFC
20. LLY
Following Stocks have broken below the consolidation zone:
1. NVDA
2. AVGO
When the up or down momentum fades in any stock, it will come inside the cloud and that is the time to exit. Happy Trading!

SHORT META Ahead of Earnings Report Based on Insider Selling"Meta Platforms Insider Sold Shares Worth $22,132,922"
Mark Zuckerberg, 10% Owner, Director, Chair of Board and Chief Executive Officer, on January 15, 2025, sold 35,921 shares in [eta Platforms. Following the Form 4 filing with the SEC, Zuckerberg has control over a total of 353,696 shares of the company, with 353,696 controlled indirectly.
Jennifer Newstead, Chief Legal Officer of Meta Platforms sold 905 shares of Class A Common Stock on January 14, 2025, at a price of $604.54 per share, totaling $547,108. Following the transaction, Newstead directly owns 31,105 shares of Meta Platforms.
Jennifer Newstead, Chief Legal Officer of Meta Platforms, sold 905 shares of Class A Common Stock on January 21, 2025, at a price of $618.0 per share, totaling $559,290. Following the transaction, Newstead directly owns 30,200 shares of Meta Platforms.
The sales were conducted under a Rule 10b5-1 trading plan adopted on November 30, 2023.
Olivan Javier, Chief Operating Officer of Meta Platforms, sold 413 shares of Class A Common Stock on January 21, 2025, at a price of $618.0 per share, totaling $255,234. Following the transaction, Javier directly owns 16,275 shares and indirectly owns 95,287 shares through various entities.
The sale was conducted under a Rule 10b5-1 trading plan adopted on August 30, 2023.

I missed my entry; I will participate if....Super enjoying missing this great entry presented today. I do feel like it's to late now, we got earnings soon, and entering this high is just asking for a drawdown. Earnings can present a good entry point if earnings respect the expansion trend. No red numbers

META - Critical AreaThe chart signals potential caution. While the price is in an uptrend, a bearish RSI #divergence and the ascending wedge suggest a possible reversal. The $500–$550 support zone will be critical in determining whether Meta continues higher or enters a correction phase.

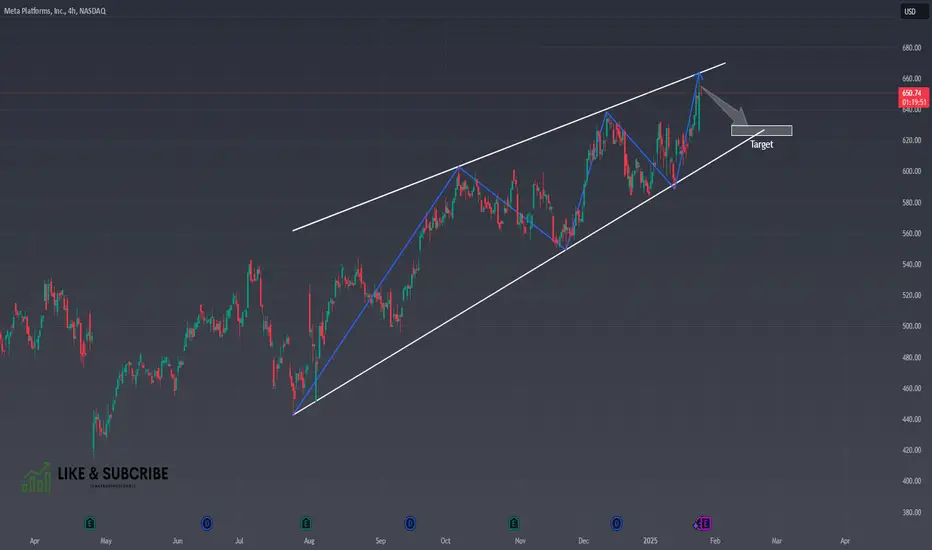
META, short, 4h✅ META is forming a clear rising wedge pattern, signaling a bearish setup. The price is expected to move lower and target the key support level.
SHORT 🔥
✅ Like and subscribe to never miss a new analysis! ✅