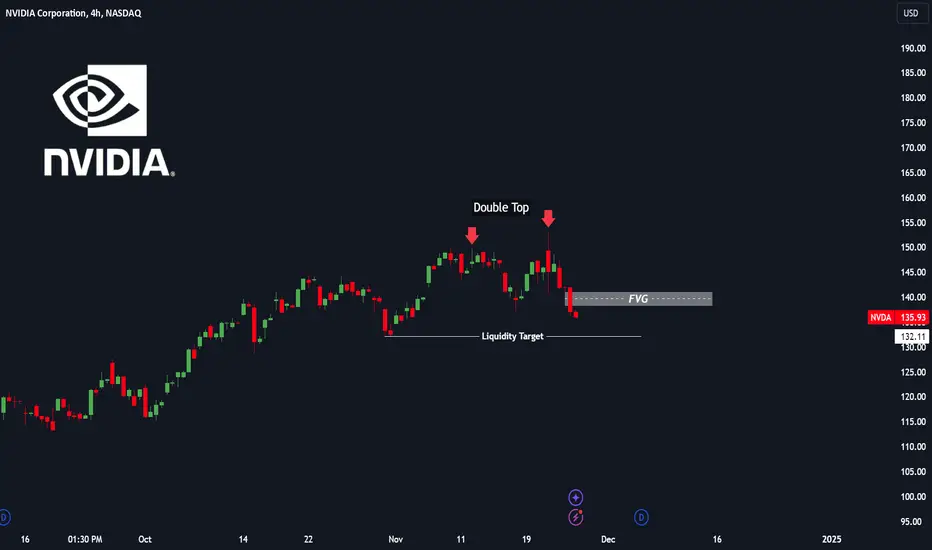
$NVDA: OUTLOOKNASDAQ:NVDA : OUTLOOK
Tomorrow, I’m eyeing a potential SHORT/PUTS trade on $NVDA. 📉
The game plan?
I’m waiting for it to rise to my FVG (Fair Value Gap) for a REJECTION, then targeting my LIQUIDITY LEVEL.
👉 LIKE & FOLLOW for more trade insights!
NVDA trade ideas
NVDA JAN 2024Breakout from large multi week base with little to no major dips. One breakout opportunity and one follow up.


The Probabilities are stacking up that Nvidia has ToppedAs I have long forecasted, Nvidia is coming into a top of either primary or intermediate degree proportion. The answer to that burning question of mine I believe gets answered in the depth of the price action's retracement lower.
Determining this answer, for me personally as an analyst, is whether or not that eventual retrace can hold above the $90.68 level, which as of this morning stands at 34% lower...so by no means am I looking at this as a mere retracement. 34% is nothing if not significant.
Along the way, we're more informed in the confidence of this forecasted pathway, if price breaches the important $128.74 level. Upon seeing such price action, I believe in the weeks (or months) ahead we could see Nvidia's price action first test $102.73 area. To hold that level and reverse in a micro 5-wave pattern, could bring about our final advance into the $170 (+) area for a long term top. That top I am forecasting in years...not months.
To breakdown below $102.73 could see us decline to as low as the low $70's before a corrective (but Tradeable) rally takes place.
Best to all,
Chris


NVDA , despite announcement ,why not 165$Despite announcement , i think NVDA wil dip more
but only to enforce its upcoming wave , to visit area of 165 $

NVIDIA: A Critical Juncture in its TrendNVIDIA’s stock has been on an impressive upward trajectory this year, but recent price action suggests it’s approaching a pivotal point. The stock has been riding a strong uptrend, anchored by a key trendline stretching from earlier lows this year. This trendline serves as dynamic support, and the current price is hovering near this critical level. Whether it holds or breaks could define the stock’s direction in the coming weeks.
A significant support zone between $130 and $140 adds to the importance of this region. This area, which previously acted as resistance, is now being retested as support. A bounce here would affirm bullish strength and could propel the stock toward its recent highs. However, there are signs of caution. Increased volume on recent bearish candles suggests selling pressure is mounting. If the price breaks below both the trendline and the support zone, it could signal a deeper correction, with the next significant support levels likely near $115 or even $100.
The immediate resistance for NVDA lies in the $150 range, where the stock previously struggled to push higher. This level represents a key obstacle for bulls. For a continuation of the bullish trend, a decisive breakout above this zone is necessary. Conversely, bearish signals, such as the recent bearish engulfing candles, indicate that sellers are gaining control, at least in the short term. A failure to hold the $130 level would confirm a breakdown and likely accelerate the downside.
For long-term investors, NVIDIA’s AI-driven growth story remains intact, but caution is warranted at these elevated valuation levels. For traders, this is a decisive moment, with opportunities both for those looking to trade the bounce and for those eyeing a breakdown.
This is a pivotal moment for NVIDIA, and patience is key in determining the next move.

NVIDIA 4thWeekNov24i will buy near base around 134
now bull run is about starting as price looking for strong supply
how far nvidia will go this time ?

$NVDA Great Dip OpportunityPrevious $128.75 Lows to $144.42 Highs = Drop to 0.786 Fib ($132)
Current $132.07 Lows to $152.90 Highs = Drop to 0.786 Fib ($136)
Gap #1: $138.66 - $141.10 (1.6% - 3.5% Gain from Current Price $136)
Gap #2: $143.89 - $146.30 (5.5% - 7.3% Gain from Current Price $136)
Currently down around 11% from All-Time Highs.
Likely to see a Bounce in the nearby future.

NVDA Bearish movementsAfter my last analysis everything seems to be headed the direction I have predicted. Beautiful doble top and break of minor trendline. I expect that the bearish flag that broke channel to the downside continues more movement with the minor bearish flag it created at close of market today in order to continue movement toward major trendline for a bounce.
In just a few more days we can buy at a discount NVDA for the upside again.

NVDA Exhaust NVDA has a unique way of going down to scale up in a multiple flag pattern towards each highs.
Last time NVDA had a leg on it’s major trend-line was July 2024.
This up movement it just did is changing the way NVDA usually scales back up and bring a similarity to when it dropped when it bounced of 131 resistance down to 110.
My prediction is this high movement to the upside is a reaction before earnings, which will cause a reason to take liquidity on the remaining portion of the resistance to become bearish.
NVDA can drop down to the FVP that never closed on the 120 area in order to make another leg on its bullish major trend-line.
If the news are good enough after the chip issue then it invalidates my prediction. But I am feeling confident on this change of structure, since NVDA is moving differently in nature.

NVDA | Unpacking NVIDIA’s Q3 FY25Building the Matrix, One GPU at a Time
This week, NVIDIA unveiled its October quarter results, capturing global attention as analysts closely monitored the stock's movements. While Wall Street often emphasizes short-term performance, a broader perspective highlights NVIDIA's remarkable rise. Over two years, its stock value has multiplied tenfold, outpacing tech giants like Alphabet and Amazon in profitability and edging closer to Microsoft and Apple in net income—a meteoric ascent for the history books.
The AI Inflection Point
NVIDIA's transformation began in November 2022 when OpenAI launched ChatGPT, described by CEO Jensen Huang as AI's "iPhone moment." Fast-forward two years, and NVIDIA's latest Blackwell GPU architecture is scaling up production, meeting surging demand. As Huang explained, "The age of AI is in full steam," driven by foundational model training and inference advancements. Two major trends underpin this shift:
-Platform evolution:Transitioning from traditional coding to machine learning.
-Emergence of AI factories:New industries powered by generative AI applications.
AI native startups are booming, and successful inference services are proliferating. If AI's trajectory mirrors the mobile revolution, this is akin to 2009 a pivotal moment with much more innovation ahead.
Q3 FY25 Highlights
NVIDIA's fiscal year ends in January, and the recently concluded October quarter (Q3 FY25) demonstrated strong momentum:
- Revenue: $35.1 billion (+17% quarter-over-quarter), exceeding expectations by $2 billion.
- Segment growth:**
- Data Center: +17% QoQ ($30.8 billion).
- Gaming: +14% QoQ ($3.3 billion).
- Automotive: +30% QoQ ($0.4 billion).
- Margins: Gross margin at 75%, operating margin at 62%.
- Cash flow: Operating cash flow of $17.6 billion; free cash flow of $16.8 billion.
- Q4 FY25 Guidance: Anticipates +7% revenue growth ($37.5 billion).
Key Drivers and Insights
-Data Center Dominance:Contributing 88% of overall revenue, driven by Hopper GPUs and the anticipated Blackwell production ramp.
-Gaming Growth:Propelled by GeForce RTX GPU demand and back-to-school sales.
-Automotive Innovation:Growth fueled by AI-powered autonomous driving solutions.
-Margins:Slight compression due to Blackwell production ramp, with recovery expected as production scales.
Looking ahead, demand for NVIDIA's Hopper and Blackwell GPUs outpaces supply, likely remaining constrained into FY26. However, challenges loom, including intensifying competition from AMD and custom AI chips.
The AI Scaling Debate
Skeptics argue AI scalability may be approaching its limits, but Huang is optimistic, citing advancements in reinforcement learning and inference-time scaling. He emphasized that AI's growth is driven by empirical laws, suggesting scalability could be extended through methods like post-training and test-time scaling.
CEO and CFO Perspectives
- Huang likens modern data centers to "AI factories," producing intelligence like power plants generate electricity.
- The shift to "physical AI" unlocks applications in industrial and robotics sectors, powered by NVIDIA's Omniverse.
- Blackwell GPUs are delivering significant cost reductions and accelerating AI workloads.
Investment Outlook
Despite valuation concerns, NVIDIA's profitability is tangible. However, the company's reliance on sustained GPU demand and a concentrated customer base presents risks. Meanwhile, competition from AMD is intensifying.
Final Thoughts
If ChatGPT was AI's "iPhone moment," the transformation is just beginning. Like the app economy in 2009, the AI-first revolution is poised to unlock entirely new markets and reshape industries. NVIDIA's leadership positions it at the forefront of this multi-trillion-dollar opportunity.

Long $NVDA @ 144.50- SL $ 137.0Long NASDAQ:NVDA @ 144.50- SL $ 137.0
Tgt $ 151
Tgt-2 - $ 155
Tgt-3 - $ 165
If its follow the great earning trend then ultimate tgt $ 190-$200
Please like and follow for more ideas
Thank you

NVIDIA I Set for Potential 20%+ Upside – Key Level Buy Welcome back! Let me know your thoughts in the comments!
** NVIDIA Analysis - Listen to video!
We recommend that you keep this pair on your watchlist and enter when the entry criteria of your strategy is met.
Please support this idea with a LIKE and COMMENT if you find it useful and Click "Follow" on our profile if you'd like these trade ideas delivered straight to your email in the future.
Thanks for your continued support!Welcome back! Let me know your thoughts in the comments!

NVDA Scalping & Swing Strategy: Liquidity Zones and Next MoveNVDA continues to show dynamic price action, making it an exciting candidate for both scalping and swing trades. Let's break down its current price structure, key levels, and potential trade setups based on technical analysis.
Market Structure:
1. Current Range: NVDA is oscillating between $137 (major support) and $152.91 (key resistance).
2. EMA Analysis: The 9 EMA and 21 EMA on the hourly chart indicate a bearish crossover, showing selling pressure dominating in the short term.
3. Volume Trends: Declining volume suggests indecision. A volume spike near key levels will confirm the next move.
Liquidity Zones:
* Demand Zone (Support): $137–$137.50. Buyers previously stepped in here, and liquidity is concentrated at this level.
* Supply Zone (Resistance): $152–$153. This is a critical zone where sellers rejected higher prices multiple times.
Key Levels:
* Support: $137.06, $141.77.
* Resistance: $144.25, $152.91.
Price Action Insights:
1. NVDA has printed lower highs, signaling bearish intent. However, the current support near $137 is holding firm, showing that buyers are active.
2. Two rejection wicks at $152 suggest that this resistance is a strong hurdle for bulls.
3. Watch for breakout momentum above $144.25 or a breakdown below $137 for confirmation of the next direction.
Order Blocks:
* Bullish Order Block: Around $137. A consolidation area where institutional buying may occur again.
* Bearish Order Block: $152–$153 zone, where sellers aggressively defended the price.
Entry & Exit Suggestions:
For Scalping:
* Entry: Look for a pullback entry near $141.50 if price shows bullish rejection wicks and volume supports upside momentum.
* Target: $144.25 (partial profits), $152 (final target).
* Stop-Loss: Below $140 to minimize downside risk.
For Swing Trade:
* Bullish Scenario:
* Entry: Above $144.25 after a clear breakout with volume confirmation.
* Target: $152.91, followed by $157 for a longer-term play.
* Stop-Loss: Below $141 to protect against false breakouts.
* Bearish Scenario:
* Entry: On a break below $137 with strong bearish candles and volume.
* Target: $130 psychological support.
* Stop-Loss: Above $138.
Thoughts & Projections:
* Bullish Case: If NVDA holds above $141.77 and breaks $144.25, it could aim for $152. However, a lack of momentum above $152 might lead to sideways action.
* Bearish Case: A breakdown below $137 could trigger significant selling pressure, targeting $130 as the next support.
Playbook & Gameplan:
1. Pre-Market Prep:
* Mark $137 and $144.25 on your chart.
* Monitor volume and price behavior near these levels.
2. Scalping Checklist:
* Wait for clear rejection wicks or engulfing candles.
* Use the 9 EMA for short-term trend confirmation.
* Take quick profits; NVDA can be volatile.
3. Swing Checklist:
* Look for higher time frame candle closes above $144.25 or below $137.
* Hold positions longer only if volume confirms breakout strength.
Conclusion:
NVDA is positioned for explosive moves as it consolidates near key liquidity zones. Scalpers can focus on quick trades between $141 and $144, while swing traders should wait for confirmation beyond the $137–$152 range. Stay disciplined and stick to your plan.
Disclaimer:
This analysis is for educational purposes only and is not financial advice. Always do your own research and manage risk appropriately before making any trades.

$NVDA with a bullish outlook following its earnings #StocksThe PEAD projected a bullish outlook for NASDAQ:NVDA after a positive over reaction following its earnings release placing the stock in drift B with an expected accuracy of 60%.
