$LAYER to $2.50?$LAYER | 1h
Solayer price is now trading above its value area high. It could establish a new value area here if we hold the poc or $2
Added measurements for potential tail imbalance profile trade setup, with possible target of $2.30 to $2.50 if Bitcoin can hold the 84k support
SOLAYERUSDT.P trade ideas

LAYER PERPETUAL TRADE , Sold at $2.17LAYER PERPETUAL TRADE
LAYER SELL SETUP
Currently $2.17
Sold at $2.17
(Trading plan If LAYER/USDT up to $2.30 will add more shorts)
Expecting target $2.06 OR DOWN
Incase of early exist will update this anaylsis
Its not a Financial advice

$LAYER — Potential Squeeze to $2.20Despite a weak market and a major token unlock, $LAYER is showing a green candle.
Solayer’s $LAYER demonstrates impressive relative strength amid tariff-driven selloffs.
It’s currently in price discovery, with $2 acting as local resistance.
If CRYPTOCAP:BTC breaks above 85k resistance, $LAYER could squeeze up to $2.20. Watching its CVD, which could retest its range high.

$LAYER/USDT Technical Breakdown – April 11, 2025📈 $LAYER/USDT Technical Breakdown – April 11, 2025
We’re seeing a strong bullish structure forming on $LAYER as price breaks out of a prolonged accumulation phase and heads toward key resistance.
🔍 Chart Overview
Price Action: Price is currently trading at 1.9320 USDT, breaking out of the previous range highs around 1.70 USDT.
Structure: Higher lows and steady volume buildup signal healthy momentum. A textbook breakout scenario.
Support Zones:
First key support: 1.70 - 1.68 USDT (previous resistance, now turned support)
Major support: 1.35 - 1.40 USDT (trendline + previous demand area)
📌 Entry Ideas
Breakout Retest Entry: Watch for a potential pullback toward 1.70 USDT. If it holds, this could be a solid entry zone for continuation.
Aggressive Entry: Some traders might enter on continuation above 1.95 USDT with strong volume confirmation.
🎯 Upside Targets
Target 1: 2.20 USDT – Closest resistance, marked by the upper consolidation zone from the chart.
Target 2: 2.50 USDT – Mid-term level if bullish momentum continues.
Target 3: 3.00+ USDT – Psychological round number and historical high zone.
🧠 Trade Management
Stop-loss: Below 1.65 USDT, in case of failed breakout and close back inside range.
Risk Management: Position sizing according to risk/reward. R:R of at least 2:1 from retest entry.
📊 RSI Note
RSI is currently hovering around 70, showing strong momentum, but entering overbought territory – monitor for divergence or weakness on lower timeframes.
enjoy and good trading!

Short opportunity for LAYERUSDTShort opportunity for LAYERUSDT
Entry around $1.8
SL: 2.09
TP: 0.65
Invalidates at 2.09+

Layer Broke All Barriers Just as predicted in Our Last Chart In our last analysis of LAYER, I predicted that LAYER is going to face a little pullback and will continue to go upwards to 2.5. If you have missed the chance to take entry, then buy tomorrow at 1.44.

Broke out of the rising wedge but...LAYERUSDT has formed higher highs and higher lows inside of the a rising wedge it created recently. Howerver, during the last trading session , price seems to have consolidated at the last low creating an extra confirmation at this level as support.
My SL is 1.7765 and TP is 1.26

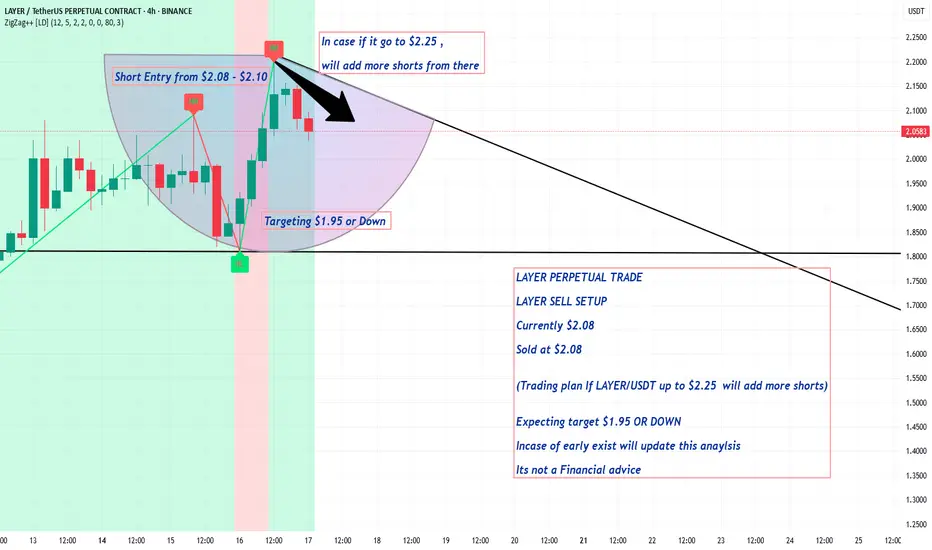
LAYER PERPETUAL TRADE ,Sold at $2.08LAYER PERPETUAL TRADE
LAYER SELL SETUP
Currently $2.08
Sold at $2.08
(Trading plan If LAYER/USDT up to $2.25 will add more shorts)
Expecting target $1.95 OR DOWN
Incase of early exist will update this anaylsis
Its not a Financial advice
Solayer Layer price analysis⁉️ Who knows why the price of #LAYER is so good "holding" in such a bad market?
🆗 Are they preparing to push the price of OKX:LAYERUSDT.P to around $2? And even there, the capitalization of the #Solayer project will be modest, by crypto standards, $420. million.
Tell us, is it worth following and investing in this project?

Trading opportunity for LAYERUSDTBased on technical factors there is a Sell position in :
📊 LAYERUSDT
🔴 Sell Now
🪫Stop loss 1.6090
🔋Target 1.0666
📏 R/R 1,5
💸RISK : 1%
We hope it is profitable for you ❤️
Please support our activity with your likes👍 and comments📝

#LAYERUSDT setup remains active 📉 LONG MEXC:LAYERUSDT.P from $1.5722
🛡 Stop loss: $1.5440
🕒 Timeframe: 1H
✅ Market Overview:
➡️ The coin is showing "its own game" — price action is independent of #BTC and #ETH, reacting to internal volume dynamics.
➡️ Ascending triangle breakout with a confirmed close above the key $1.5440 zone.
➡️ Empty space ahead — no major resistance levels until $1.6060–$1.6210.
➡️ Accumulation is forming between $1.5440–$1.5700 — a breakout may follow.
➡️ Important: candles must close above $1.5440 to confirm the long scenario.
🎯 TP Targets:
💎 TP1: $1.5880
💎 TP2: $1.6060
💎 TP3: $1.6210 (full measured move from triangle pattern)
📢 Recommendations:
If volume MEXC:LAYERUSDT.P increases during a breakout above $1.5722 — expect a rapid move.
If price pulls back — the $1.5254 area could offer a second entry opportunity.
The coin looks strong but slightly overbought — partial take profit at TP1 is advised.
📢 A strong breakout above $1.5700 may lead to a sharp move due to lack of resistance.
📢 Avoid 1H candle close below $1.5440 — scenario invalidation.
📢 If the move occurs on weak volume — watch for a potential reversal near TP1.
🚀 MEXC:LAYERUSDT.P setup remains active — holding the key level could lead to a move toward TP2–TP3!

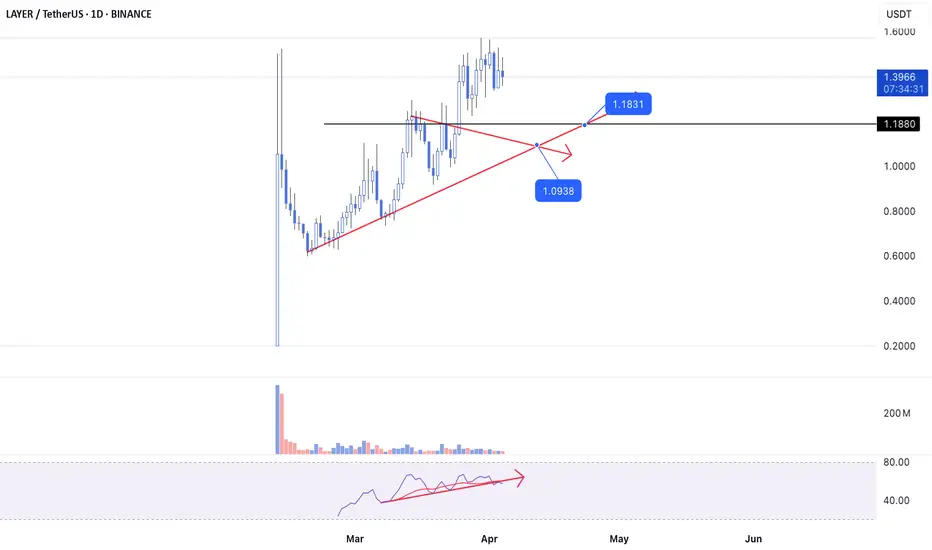
Layer - ShortDear my friends,
I’m observing the Layer chart on larger timeframes. And when switching to the daily timeframe, my perspective becomes quite clear. With the RSI having dropped below support along with a divergence between price and RSI, I’m seeing two support zones that the Layer price might return to: $1.18 or $1.09. I’ll short here and wait for the price to move to these two zones before making my next decision.
Best Regards,

Layer to 2.5 or Back to 1.2? Buyers Look Strong Looks like Layer is gearing up for a breakout! Buyers are showing strong momentum, and the trend is definitely in their favor. What are your thoughts? Share your ideas in the comments!

$LAYER could shoot up to $2 to $2.50Solayer (LAYER) is standing out strongly, forming a series of higher lows while maintaining its parabolic curve.
Among the altcoins, LAYER has been one that is consistently trending upward, as is evident in its chart.
$1.60 appears to be the immediate hurdle, acting as resistance. I expect a massive breakout if we can manage to surpass this level.
Alternatively, if we can stay above $1.20, might pave the way up to $2, potentially extending as high as $2.50 (short term)

LAYERUSDT – Patience Wins the Trade📌 Green Box = Key Support Zone – This is where smart money might step in.
🚨 No Need to Rush Shorts!
Waiting for Price to Reach the Target → Jumping in too early is gambling, not trading.
LTF Confirmations are Everything → If we see a reaction + CDV confirmation, then we evaluate.
Break Below? → If price slices through support without demand, we shift the plan.
📊 Discipline beats impulse. Most lose money chasing trades—we wait, we execute, we profit.
✅I keep my charts clean and simple because I believe clarity leads to better decisions.
✅My approach is built on years of experience and a solid track record. I don’t claim to know it all but I’m confident in my ability to spot high-probability setups.
✅If you would like to learn how to use the heatmap, cumulative volume delta and volume footprint techniques that I use below to determine very accurate demand regions, you can send me a private message. I help anyone who wants it completely free of charge.
🔑I have a long list of my proven technique below:
🎯 ZENUSDT.P: Patience & Profitability | %230 Reaction from the Sniper Entry
🐶 DOGEUSDT.P: Next Move
🎨 RENDERUSDT.P: Opportunity of the Month
💎 ETHUSDT.P: Where to Retrace
🟢 BNBUSDT.P: Potential Surge
📊 BTC Dominance: Reaction Zone
🌊 WAVESUSDT.P: Demand Zone Potential
🟣 UNIUSDT.P: Long-Term Trade
🔵 XRPUSDT.P: Entry Zones
🔗 LINKUSDT.P: Follow The River
📈 BTCUSDT.P: Two Key Demand Zones
🟩 POLUSDT: Bullish Momentum
🌟 PENDLEUSDT.P: Where Opportunity Meets Precision
🔥 BTCUSDT.P: Liquidation of Highly Leveraged Longs
🌊 SOLUSDT.P: SOL's Dip - Your Opportunity
🐸 1000PEPEUSDT.P: Prime Bounce Zone Unlocked
🚀 ETHUSDT.P: Set to Explode - Don't Miss This Game Changer
🤖 IQUSDT: Smart Plan
⚡️ PONDUSDT: A Trade Not Taken Is Better Than a Losing One
💼 STMXUSDT: 2 Buying Areas
🐢 TURBOUSDT: Buy Zones and Buyer Presence
🌍 ICPUSDT.P: Massive Upside Potential | Check the Trade Update For Seeing Results
🟠 IDEXUSDT: Spot Buy Area | %26 Profit if You Trade with MSB
📌 USUALUSDT: Buyers Are Active + %70 Profit in Total
🌟 FORTHUSDT: Sniper Entry +%26 Reaction
🐳 QKCUSDT: Sniper Entry +%57 Reaction
📊 BTC.D: Retest of Key Area Highly Likely
📊 XNOUSDT %80 Reaction with a Simple Blue Box!
📊 BELUSDT Amazing %120 Reaction!
I stopped adding to the list because it's kinda tiring to add 5-10 charts in every move but you can check my profile and see that it goes on..

layer usdtbuy 1.422 nearest point u can buy
for stop Loss and profit click on chart.
always use stop loss.

LAYERUSDT → Far retest of key resistance at 1.400BINANCE:LAYERUSDT.P is forming a realization within the uptrend. The coin is stronger than the market, but the initial reaction to the strong resistance at 1.400 may be in the form of a false breakout and a pullback to 1.275 or 0.5 fibo
Since the opening of the session, LAYERUSDT has passed the daily ATR, but after reaching the resistance, the coin may not have the potential to continue rising. Liquidity above the 1.400 level may hold this area and prevent the coin from breaking through this zone the first time around.
Bitcoin is testing trend resistance at this time and could likely form a rebound or a continuation of the decline, which could affect altcoins accordingly!
Resistance levels: 1.400
Support levels: 1.2932, 1.2747, 0.5 fibo
BUT ! Everything depends on the price reaction at 1.400. A sharp and distributive approach with 90% probability will end in a false breakout and correction to the mentioned targets.
But, if LAYER starts to slow down and consolidate in front of the level, an attempt of breakout and struggle above 1.400 is possible and further movement will depend on it.
Regards R. Linda!

LAYER/USDT Analysis: Trade for Trend ContinuationThis asset has relatively low correlation with Bitcoin and remains in an uptrend.
A long position is considered upon a test and buyer reaction in the $1.2-$1.12 zone , with an initial target of $1.4.

LAYERUSDT...For retest of key resistanceFrom the chart:
Entry Point: Around 1.3887 (marked near the peak of the current structure).
Target (TP): Around 1.0859 (near the lower support zone).
Stop Loss (SL): Around 1.5459 (above the resistance zone).
Key Levels
Resistance: ~1.3887 (current structure high) and ~1.5259 (upper boundary of channel).
Support: ~1.0859 (previous significant low and lower boundary of channel).
This setup suggests a short position with a favorable risk-to-reward ratio. Ensure you wait for confirmation signals like bearish candlestick patterns or volume confirmation before entering.

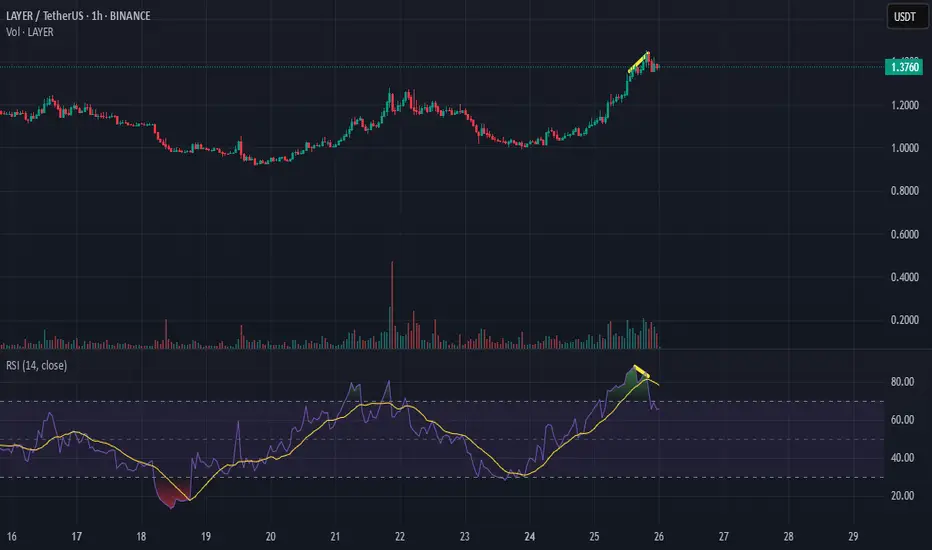
"Bearish Divergence Alert: Is LAYER About to Dip?"LAYER/USDT is showing a classic bearish divergence on the 1-hour chart. While the price made a higher high, the RSI printed a lower high, signaling weakening bullish momentum. This could indicate an upcoming pullback or trend reversal. Traders should watch for a break of key support levels and bearish confirmation signals before making their next move. Is this the start of a correction? Stay cautious!
Long LayerLayer broke through the resistance level on daily chart. The bullish movemen to $2.4 is possible

LAYERUSDT CHART ANALYSİS - EDUCATIONAL POSTConclusion
The NFT market is developing extremely fast, and the blockchain infrastructure has undergone significant changes over the past few years. However, today, there are still many questions about how the NFT market can function and in which areas non-fungible tokens can be used.
For example, one potential application of NFT is the blockchain recording of unique documents. Due to the reliability of the blockchain, diplomas, certificates, and various documents can be issued in NFT format, potentially helping to eliminate the risk of forgery.
NFTs are likely to have, and are already having, some impact on formats for creating and distributing content, and art objects. For now, however, it is primarily a trending investment tool for crypto enthusiasts around the world. The numerous possibilities of this technology will be revealed in the coming years.
