The key is whether it can be supported and rise near 137.28
Hello, traders.
If you "Follow", you can always get new information quickly.
Please also click "Boost".
Have a nice day today.
-------------------------------------
The April TradingView competition is sponsored by PEPPERSTONE.
Accordingly, we will look at the coins (tokens) and items that can be traded in the competition.
Let's talk about the SOLUSD chart.
--------------------------------------
(ETHUSD 1D chart)
The circled sections on the chart are important support and resistance sections.
Since the M-Signal indicators on the 1D, 1W, and 1M charts are passing through the 137.28-180.38 range, it is important to see whether it can receive support and rise this time.
If it fails to rise, it is likely to fall to the Fibonacci ratio range of 2 (80.31) ~ 1.902 (88.47).
-
We need to see if the OBV can rise above the Fibonacci ratio of 1.27 (141.08) as it rises above the middle line.
Since the OBV indicator itself has fallen below the 0 point, there is a high possibility that the selling pressure will increase.
Therefore, we need to check the support and resistance points when the OBV rises above the 0 point.
If it shows support near 180.38, I think it is highly likely that it will turn into an upward trend and rise.
-
Therefore, when the competition starts, check if it is located in the 137.28-180.38 range, and if not, it is expected that a sell (SHORT) position will be advantageous.
Even if the price is maintained above 137.28,
- There is a possibility that it will be difficult to maintain a buy (LONG) position due to the fact that the OBV is located below the 0 point,
- The M-Signal indicator on the 1W, 1M charts is in a reverse arrangement, etc.
-
Thank you for reading to the end.
I hope you have a successful transaction.
--------------------------------------------------
- This is an explanation of the big picture.
I used TradingView's INDEX chart to check the entire range of BTC.
I rewrote it to update the previous chart while touching the Fibonacci ratio range of 1.902 (101875.70) ~ 2 (106275.10).
(Previous BTCUSD 12M chart)
Looking at the big picture, it seems to have been following a pattern since 2015.
In other words, it is a pattern that maintains a 3-year bull market and faces a 1-year bear market.
Accordingly, the bull market is expected to continue until 2025.
-
(Current BTCUSD 12M chart)
Based on the currently written Fibonacci ratio, it is displayed up to 3.618 (178910.15).
It is expected that it will not fall again below the Fibonacci ratio of 0.618 (44234.54).
(BTCUSDT 12M chart)
I think it is around 42283.58 when looking at the BTCUSDT chart.
-
I will explain it again with the BTCUSD chart.
The Fibonacci ratio ranges marked in the light green boxes, 1.902 (101875.70) ~ 2 (106275.10) and 3 (151166.97) ~ 3.14 (157451.83), are expected to be important support and resistance ranges.
In other words, it seems likely to act as a volume profile range.
Therefore, in order to break through this section upward, I think the point to watch is whether it can rise with support near the Fibonacci ratios of 1.618 (89126.41) and 2.618 (134018.28).
Therefore, the maximum rising section in 2025 is expected to be the 3 (151166.97) ~ 3.14 (157451.83) section.
To do that, we need to look at whether it can rise with support near 2.618 (134018.28).
If it falls after the bull market in 2025, we don't know how far it will fall, but considering the previous decline, we expect it to fall by about -60% to -70%.
So, if the decline starts near the Fibonacci ratio 3.14 (157451.83), it seems likely that it will fall to around Fibonacci 0.618 (44234.54).
I will explain more details when the downtrend starts.
------------------------------------------------------
SOLUSD.P trade ideas

Solana, where do we go?Someone got any idea about what solana might do? Or we are at support and going to make a wave 5, or we did a double top and break completly down?

SOLANA (SOLUSD): Bullish Reversal Confirmed
It looks like Solana is ready to return to a bullish trend.
We see multiple strong price action confirmations after
a test of a significant daily support.
The price formed the ascending triangle on that, and violated
both its neckline and a resistance line of a falling wedge pattern.
Looks like the market can reach 180 level easily soon.
❤️Please, support my work with like, thank you!❤️

SOL/USD - Smart Plays in Motion The 4H is printing bearish structure, signaling strong selling intent—but there’s a key detail: liquidity hasn’t been swept yet. That tells me there’s still room for a bullish retracement before the next major move.
On the 30M, I’ll be riding the bullish momentum, looking for continuation buys until price reaches the nearby 30M supply. That’s where my attention shifts—once price mitigates that area, I’ll be ready for the next play. Let’s see how it unfolds.
Bless Trading!

SOL/USD "Solana vs US Dollar" Crypto Market Heist Plan🌟Hi! Hola! Ola! Bonjour! Hallo! Marhaba!🌟
Dear Money Makers & Robbers, 🤑💰✈️
Based on 🔥Thief Trading style technical and fundamental analysis🔥, here is our master plan to heist the SOL/USD "Solana vs US Dollar" Crypto market. Please adhere to the strategy I've outlined in the chart, which emphasizes short entry. Our aim is the high-risk Green Zone. Risky level, oversold market, consolidation, trend reversal, trap at the level where traders and bullish robbers are stronger. 🏆💸Book Profits Be wealthy and safe trade.💪🏆🎉
Entry 📈 : "The vault is wide open! Swipe the Bearish loot at any price - the heist is on!
however I advise to Place buy limit orders within a 15 or 30 minute timeframe most recent or swing, low or high level. I Highly recommended you to put alert in your chart.
Stop Loss 🛑:
Thief SL placed at the recent / swing low level Using the 4H timeframe (150.00) swing trade basis.
SL is based on your risk of the trade, lot size and how many multiple orders you have to take.
Target 🎯: 90.00 (or) Escape Before the Target
🧲Scalpers, take note 👀 : only scalp on the Short side. If you have a lot of money, you can go straight away; if not, you can join swing traders and carry out the robbery plan. Use trailing SL to safeguard your money 💰.
SOL/USD "Solana vs US Dollar" Crypto market is currently experiencing a Bearish Trend,., driven by several key factors. 📰🗞️Read Fundamental, Macro, COT Report, On Chain Analysis, Sentimental Outlook, Intermarket Analysis, Future Prediction:
📌Keep in mind that these Fundamental factors can change rapidly, and it's essential to stay up-to-date with market developments and adjust your analysis accordingly.
⚠️Trading Alert : News Releases and Position Management 📰 🗞️ 🚫🚏
As a reminder, news releases can have a significant impact on market prices and volatility. To minimize potential losses and protect your running positions,
we recommend the following:
Avoid taking new trades during news releases
Use trailing stop-loss orders to protect your running positions and lock in profits
💖Supporting our robbery plan 💥Hit the Boost Button💥 will enable us to effortlessly make and steal money 💰💵. Boost the strength of our robbery team. Every day in this market make money with ease by using the Thief Trading Style.🏆💪🤝❤️🎉🚀
I'll see you soon with another heist plan, so stay tuned 🤑🐱👤🤗🤩

Nice Long Opportunity SolanaI'm long @ 125
Good opportunity to retest 160 or 175 with two major levels of support @ 122 and 111
What I see:
Mar 11/12th Liquidity Grab just below first level of support followed by a retest
Regression line from 293 High is about to be broken
Triangle forming and potential breakout
Solana (SOL/USDT) Scalping Strategy – Key Support Breakout & TraThis Solana (SOL/USDT) scalping trade on the 5-minute chart highlights a high-probability long setup following a breakout above a key resistance level. After bouncing off the 129.12 moving average (MA) and holding support at $129.01, SOL is showing bullish continuation.
The trade plan includes an entry at $130.31, with a stop-loss set below support at $129.01 to minimize downside risk. The take-profit target is positioned at $135.94, aligning with previous resistance and liquidity zones, ensuring an optimal risk-to-reward ratio.
This setup leverages momentum trading and breakout confirmation for short-term gains. Stay updated on Solana price action, market structure, and technical indicators to refine your crypto trading strategy.
#Solana #SOLUSD #CryptoScalping #BreakoutTrade #TechnicalAnalysis #CryptoTrading

$125 buy target for Solana$125 buy target for Solana
My previous analysis came to play. The green TL acted as resistance zone despite the false breakout.
I see this baby coming down to kiss the blue TL as a support level before another push up.
I have a buy entry for $125.
Trade with caution as crypto market is a volatile one.
Please share your thoughts, like and follow for more charts.

SOLANA RANGING AREAbetter waiting and start buy after Q3
the best permormance matric Q4 and early selling your coin in desember

SOLUSDSOLUSD Trading near to their Support and Resistance. Let's See what happens, we plan trades according to the market conditions don't be hurry. This is An Educational Purpose, its not any Tip and advice for buying and Selling Plan your Trades based on your own Researchs

KEEP TRADING SIMPLE - SOLGood Morning,
Another Crypto looking healthy today. Again lets waiting for confirmation of the support before entering this swing trade opportunity.
Thanks

KEEP TRADING SIMPLE - SOLUSDGood Morning,
Hope all is well. SOL has reached a support area. Trend is showing Bullish. we had a minor break out which ended up being a fakeout/ possibly the start of another descending triangle.
Bearing volume is fading, although bullish volume is also not increasing, signalling further consolidation.
I will be waiting for further confirmation to enter a trade.
Thanks

SOL/USD Technical Analysis (March 31, 2025)🔹 Potential Scenarios:
✅ Bullish Path (Green): If the price holds above the Golden Pocket (119.89 - 121.15) and breaks 147.38, it may continue rising toward 165-176 and possibly 201-210.
❌ Bearish Path (Red): A drop below 112.40 could push the price toward 109-119, and further breakdown may lead to 78-86 or even 51-57 in extreme cases.
🔄 Neutral/Alternative Path (Yellow): If support holds but no strong breakout occurs, the price may consolidate and later move in either direction.
💡 Key Levels to Watch:
Resistance: 147.38, 165-176, 201-210, 272+
Support: 119-121 (Golden Pocket), 112.40, 78-86, 51-57
📌 Keep an eye on price reactions at these levels to confirm the next move.

Nerd Pips - Signals and Analysis { Buy Solan or Solana }SOLUSD H4, D1, W1
The price trend has been moving and touch support and resistance for weekly to uptrend for Swing, currently the price is starting to continue its decline.
You can take advantage of the Buy opportunity with the setup:
SL: 110.50992 / 100.76501
TP 1: 181.65204
TP 2: 210.475
TP 3: 283.959

Solana (SOL/USDT) Buy Setup: Targeting $146
.Dramatic Volume Decrease: Trading volume has plummeted from $1.99 billion in November to just $14.57 million by March 2025, representing a staggering 99% decrease
. This substantial reduction in volume suggests weakening market participation and could make it challenging to sustain a rally towards the $146 target.
Recent Volume Collapse: A more recent 61% drop in trading volume has been observed, bringing the volume down to $130 million
. This sharp decline indicates weak buying pressure, which could hinder the price movement towards the $146 target.
Trading Volume Patterns
Analyzing trading volume patterns provides insights into market dynamics:
DEX Volume Milestone: Solana-based decentralized exchanges (DEXs) achieved approximately $3.8 billion in 24-hour trading volume on January 6, 2025, surpassing Ethereum and Base combined
. This milestone highlights the growing dominance and liquidity of Solana's DEXs, particularly Raydium, which could support increased trading activity.
Derivatives Market Activity: Trading volume in Solana's derivatives market has dropped by 28.06%, while open interest has increased slightly by 0.81%
. This mixed signal in the derivatives market indicates cautious sentiment among traders, which could impact the path to $146.
Volume-Price Divergence: The significant decrease in trading volume coupled with price fluctuations suggests a potential divergence. This divergence could indicate that the current price levels may not be supported by strong buying pressure, making the $146 target more challenging to achieve without a substantial increase in volume.

KEEP TRADING SIMPLE - SOLUSDGood Morning,
Sol has made a progressive move towards a new consolidation area. It will either hit and run and drop below. Climb into consolidation zone or climb through into new high.
My current bet with the way volume is going is that it will climb into the accumulation zone with a double leg into new high. Confidence at 65%.
Thanks


Solana Bearish oversold bounce back capped by 136.68Solana price action exhibits a bearish sentiment, driven by the prevailing downtrend. The recent price movement appears to be an oversold bounce back, forming a bearish sideways consolidation pattern. This indicates that bearish pressure remains dominant despite a temporary upward correction.
Key Level (136.68):
The critical trading level to monitor is 136.68, which marks the previous intraday consolidation zone. An oversold rally approaching this level could face bearish rejection, reinforcing the continuation of the downtrend. A failure to break above this resistance level would likely prompt further downside movement.
Support Levels:
If the bearish sentiment prevails and the price is rejected from the 136.68 level, the downside targets include:
119.80 - Immediate support level.
105.21 - Secondary support.
97.71 - Long-term support level.
Bullish Scenario:
Conversely, a confirmed breakout above the 136.68 resistance level, followed by a daily close above it, would negate the bearish outlook. This breakout could initiate further upward momentum, targeting:
142.24 - Initial resistance after the breakout.
149.90 - Subsequent resistance level.
Conclusion:
The overall sentiment for Solana remains bearish, with 136.68 acting as the pivotal resistance level. An oversold bounce approaching this level may face rejection, signaling a continuation of the downward trend. However, a breakout and daily close above 136.68 could shift the sentiment to bullish, opening the path for further gains toward 142.24 and 149.90. Traders should remain cautious and watch for confirmation signals at the critical resistance level.
This communication is for informational purposes only and should not be viewed as any form of recommendation as to a particular course of action or as investment advice. It is not intended as an offer or solicitation for the purchase or sale of any financial instrument or as an official confirmation of any transaction. Opinions, estimates and assumptions expressed herein are made as of the date of this communication and are subject to change without notice. This communication has been prepared based upon information, including market prices, data and other information, believed to be reliable; however, Trade Nation does not warrant its completeness or accuracy. All market prices and market data contained in or attached to this communication are indicative and subject to change without notice.

SOLANA Stock Chart Fibonacci Analysis 032025Trading Idea
1) Find a FIBO slingshot
2) Check FIBO 61.80% level
3) Entry Point > 129/61.80%
Chart time frame: B
A) 15 min(1W-3M)
B) 1 hr(3M-6M)
C) 4 hr(6M-1year)
D) 1 day(1-3years)
Stock progress: B
A) Keep rising over 61.80% resistance
B) 61.80% resistance
C) 61.80% support
D) Hit the bottom
E) Hit the top
Stocks rise as they rise from support and fall from resistance. Our goal is to find a low support point and enter. It can be referred to as buying at the pullback point. The pullback point can be found with a Fibonacci extension of 61.80%. This is a step to find entry level. 1) Find a triangle (Fibonacci Speed Fan Line) that connects the high (resistance) and low (support) points of the stock in progress, where it is continuously expressed as a Slingshot, 2) and create a Fibonacci extension level for the first rising wave from the start point of slingshot pattern.
When the current price goes over 61.80% level , that can be a good entry point, especially if the SMA 100 and 200 curves are gathered together at 61.80%, it is a very good entry point.
As a great help, tradingview provides these Fibonacci speed fan lines and extension levels with ease. So if you use the Fibonacci fan line, the extension level, and the SMA 100/200 curve well, you can find an entry point for the stock market. At least you have to enter at this low point to avoid trading failure, and if you are skilled at entering this low point, with fibonacci6180 technique, your reading skill to chart will be greatly improved.
If you want to do day trading, please set the time frame to 5 minutes or 15 minutes, and you will see many of the low point of rising stocks.
If want to prefer long term range trading, you can set the time frame to 1 hr or 1 day.

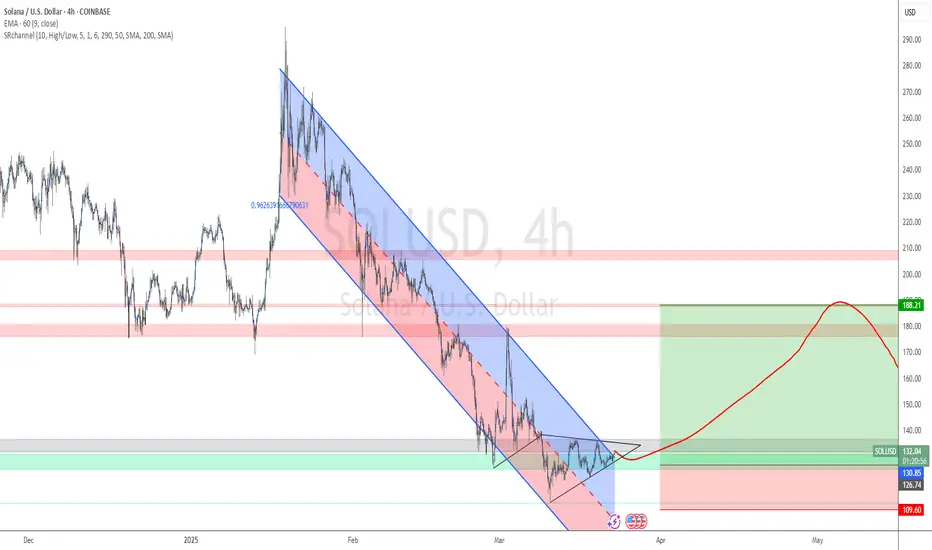
SOLANA/USD 4HOURS CHART DISPLAYS ASTRONG BEARISH TREND1. Downtrend & Market Structure:
The chart displays a strong bearish trend with a downward channel (red and blue zones), indicating previous selling pressure.
The price has broken out from this bearish structure, showing signs of recovery.
2. Harmonic Pattern Formation:
A harmonic pattern (possibly Gartley or Butterfly) is drawn with labeled points X, A, B, C, D.
These patterns are used to predict potential reversal points in the market.
3. Trade Setup:
Entry Zone (Red Box): Suggested area where traders might open short positions.
Target Zone (Green Box): Marked as a potential profit-taking level.
Projected Price Movement: A zigzag price movement is drawn, indicating a possible rejection from the entry zone and a move toward the target.
4. Support & Resistance Levels:
Support around 108.63: Possible bounce area.
Resistance near 141.9: Price might struggle to break this level.
5. Overall Analysis:
The chart suggests a short-selling opportunity, expecting a drop after a potential rejection from resistance.
If the price breaks above resistance, the bearish scenario may be invalidated.

SOLUSD Analysis1. Current Price Context
Price Movement: SOL has gained 7.44% recently, showing strong upside potential.
Trend Structure: The price is attempting to break above key resistance zones after bouncing from recent lows.
2. Key Support & Resistance Levels
Support Levels (Downside Risk)
$131.80–$133.80 Zone – Current short-term support. If price holds above this range, bullish continuation is likely.
$124.87 – Major support level. If SOL falls below this, the bullish momentum could fade.
Resistance Levels (Upside Targets)
$135.99 – Immediate resistance level SOL is currently testing.
$137.00–$138.00 – Next resistance; breaking this could accelerate a move higher.
$150.50 – Primary target and the key resistance in the next leg up.
3. Technical Indicators & Trend Analysis
EMA Ribbon (Dynamic Support/Resistance)
The EMA ribbon is acting as resistance, and SOL is currently battling to break above it.
A decisive close above the ribbon would be a strong bullish signal.
Trendline Analysis
The downward trendline from previous highs intersects near $150.50, meaning this level is crucial for breakout confirmation.
If price reaches $150 and consolidates, it could set up a trend reversal to the upside.
Volume & Momentum Indicators
RSI (Relative Strength Index): 39.38 – showing weak bullish momentum, but not overbought.
MACD (Moving Average Convergence Divergence): -11.97 – still negative, but improving, indicating potential upside acceleration.
Volume Analysis: Needs a significant increase for confirmation; if price rises with low volume, a rejection at resistance is likely.

JUST IN: First Solana ETFs to Launch in The US TomorrowThe highly functional open source project that banks on blockchain technology’s permissionless nature to provide decentralized finance (DeFi) solutions is set to debut its First Spot ETFs in the US tomorrow.
Price of Solana ( CRYPTOCAP:SOL ) surged 5% today amidst Solana ETFs set to to be launch tomorrow. A news that made Solana reclaim the $130 zone. With build-up momentum and RSI barely overbought at 53 CRYPTOCAP:SOL is set to break the 38.2% Fibonacci retracement point a level that aligns with $150- 160.
A break above this pivot point could send solana on a bullish course with eyes set on the $200- 270 price points.
Similarly, in the case of a reprieve, CRYPTOCAP:SOL might find support in the 78.6% Fibonacci retracement point before picking momentum up.
Solana Price Live Data
The live Solana price today is $130.00 USD with a 24-hour trading volume of $2,966,846,344 USD. Solana is up 5.12% in the last 24 hours, with a live market cap of $66,305,695,632 USD. It has a circulating supply of 510,033,072 SOL coins and the max. supply is not available.

An overall look at SOL with my April flash crash thesis embeddedSOL is forming a massive cup-and-handle pattern overall. However, when zooming into the short-term pattern currently unfolding, I believe we will see a false breakout leg on the fifth wave, leading to a 'flash crash' in mid to late April. After this occurs, the true breakout will likely happen on the seventh wave, taking out the pattern high and running to the top of the broadening wedge pattern—or perhaps even higher—given the bigger picture of a massive cup-and-handle formation that has been developing for over three years.
Good luck, and always use a stop-loss!
