Is a great time for holding Solana?!Hello guys!
What I see:
Ascending Channel: Price has been moving inside a clearly defined upward-sloping channel since the start of 2023, showing a strong long-term uptrend.
33% Correction: Recently, SOL experienced a 33% correction from its local high, testing the previous breakout zone (highlighted in light blue). This area has now acted as a strong support.
Bullish Signal: Price is attempting to reclaim and close above a key horizontal resistance level (~$132), noted by the text: “If the price closes above this level, then buy it.” A close above this level would confirm a bullish reversal and suggest strength returning to the trend.
RSI Outlook: The RSI indicator at the bottom shows a potential reversal from the lower range, indicating possible bullish momentum building.
Projection: If the price successfully closes above the mentioned resistance zone, the structure supports a potential move toward a new high, as marked by the arrow pointing toward the upper channel boundary (above $250 and potentially up to $300+).
SOLUSD trade ideas

SOL USD LONG IdeaBased on a fibonacci speed fam from the all time low to all time high along with a fibonacci retracement both point out that the price has retraced down to the golden pocket areas. Based on the supoort holding, along with other indicators I'm using points out a very likely move to the upside of ~20%.

SOLANA (#SOLUSD): Bullish Outlook & BreakoutSOLANA formed an inverted head and shoulders pattern on both daily/intraday charts.
Following the release of last Friday's fundamentals, the market experienced a significant surge, breaking through its neckline and a strong falling trend line.
This led to a consequent strong bullish movement and change of character CHoCH. These broken structures now form an expanding demand zone.
I will be looking for a buying opportunity in this zone, anticipating a bullish reversal towards the 150 support level.

Solana Surges Nearly 8% As Janover Pivots to Solana Treasury The price of Solana ( CRYPTOCAP:SOL ) famously known as the ethereum killer has surged nearly 8% today as Commercial property platform Janover pivots to Solana treasury strategy, stock surges 1,100% as investors rush in prior the news.
Janover has invested over $9.6 million into Solana (83,000+ SOL) as part of a new digital asset treasury strategy, with plans to stake its holdings and run validators to generate onchain revenue.
The move follows a $42 million funding round and has triggered a 1,100% surge in Janover’s stock price as the company positions itself as a transparent, publicly traded vehicle for crypto exposure.
Solana has lost grip of the $120 pivot for the past 2 weeks, but reclaimed the zone today currently trading at $120.54 per $SOL.
The daily price chart shows Solana has been trading within an enclose rectangular zone with the Resistant and support points slightly above each other. For Solana, a break above the $170 zone could pave way for a move to the $200- $270 zone. Similarly, a break below the $100 zone could be catastrophic for Solana.
However, the RSI shades a bit of a light at the end of the tunnel as it stands at 47, which is prime for a reversal.

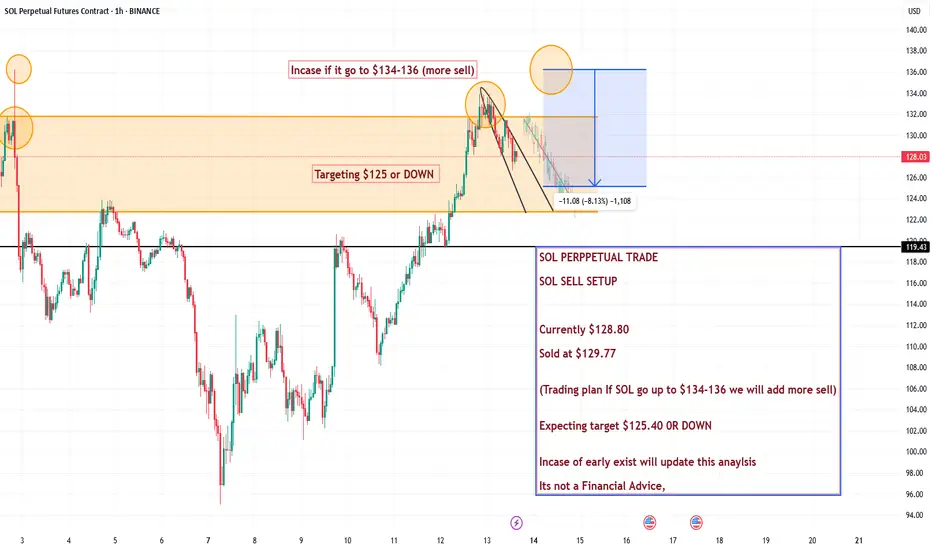
SOL PERPPETUAL TRADE , Sold from $129.77SOL PERPPETUAL TRADE
SOL SELL SETUP
Currently $128.80
Sold at $129.77
(Trading plan If SOL go up to $134-136 we will add more sell)
Expecting target $125.40 0R DOWN
Incase of early exist will update this anaylsis
Its not a Financial Advice,
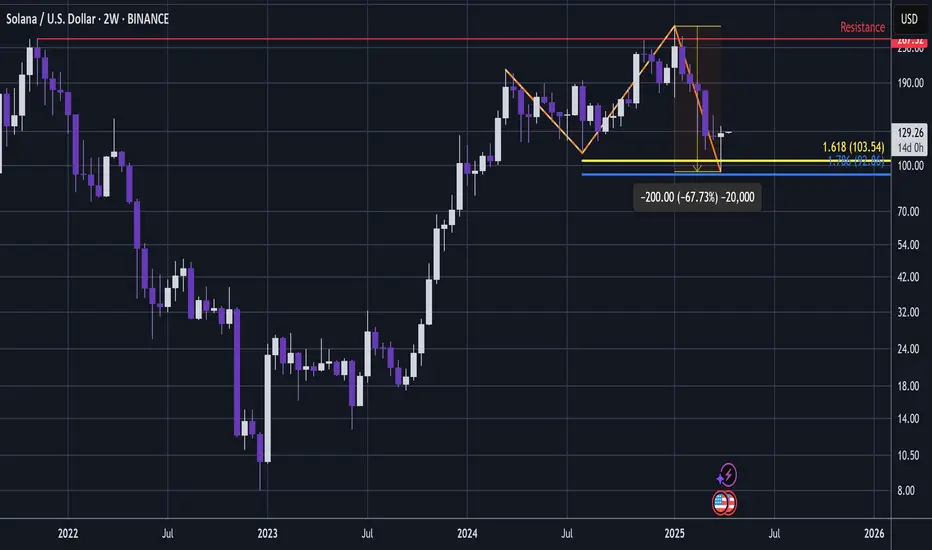
SOLANA on its huge Bull Cycle Support.Solana / SOLUSD just hit the Rising Support that started back on the December 26th 2022 Bear Cycle Bottom.
Meanwhile, it hit for the first time in its history its 1week MA200. This is a huge Support cluster.
Having declined by -68.21% from its January All Time High, it looks identical to the last correction (also -68.21%) of the last Bull Cycle in May-June 2021.
A +1278% rally followed and it since we now enter the final phase of the Bull Cycle with the most aggressive rallies historically made, a new +1278% increase is technically possible.
Target 1200.
Follow us, like the idea and leave a comment below!!

SOL - Bottom 2025COINBASE:SOLUSD
95USD SOL is a good deal for long term hold
This looks like a bottom on 1 minute chart :-)

Solana/USD at a pivotal pointSolana has been in a downtrend since 1-19-25 creating lower lows and lower highs. Bearish death cross was confirmed in middle of March. Price is retesting major support that was broken around the $125.00 area. Only a reclaim and higher high of this area would give any indications of a possible bottom. $147.60 area would have to be broken for a break of structure to the upside and a confirmed deviation of the consolidation range.
Major resistance levels are marked on the chart and also the anchored vwaps that are anchored to important/specific price areas. These areas are points of interest where candle confirmation can lead to higher probability trades. $90.36 area looks to be wanting to be tested which is the anchor point of the vwap from the low of this entire move from late 2022.

SOL - High Time Frame Technical EntrySOL #6
There are a few coins I am buying now based on the 2 week candle that just closed.
SOL is one of them.
It has printed what appears to be a very tidy high time frame, 3 wave, 1:1.618 Golden Window correction.
The 2 week candle just closed is a bullish long wicked hammer that bounced from within the Golden Window band; just beyond the 1.618.
And so we have the price action signalling that the 1.618 GW has a decent chance to have captured a high time frame pivot low.
If it has then this is now the next wave up.
Worth noting also that although the correction may not appear too deep, this chart is in log and thats a 67% drawdown since January.
Its not too far off the percentage loss of a Bitcoin bear market.
Could wobble in low time frame; who knows really...
I bought more here 👍.
Not advice
Solana - The Bullrun Is Not Over Yet!Solana ( CRYPTO:SOLUSD ) might create another move higher:
Click chart above to see the detailed analysis👆🏻
As we are speaking Solana is sitting at the exact same level as it was about 3.5 years ago in the end of 2021. In the meantime we saw a lot of volatility and Solana is now once again retesting a major previous support level. Despite the harsh recent drop, the bullrun remains valid to this day.
Levels to watch: $120, $250
Keep your long term vision,
Philip (BasicTrading)

Solana preparing for launch to the moon!Fundamental is strong and technically right now is it time to get in. What do you think?

SOL dead cat bounce?We saw a very successful bounce from the bottom of the golden pocket thanks to the 90-day tariff pause announcement, however we have stayed inside the downtrend pattern which I have highlighted. We could see a slow and steady decline back towards the golden pocket area. The theory here is that if we bounce again, we would be looking at a double bottom which is a bullish signal. Let's see how it goes. Feel free to let me know your thoughts.

SOL - Longs on the Horizon!Hello TradingView Family / Fellow Traders. This is Richard, also known as theSignalyst.
📈 Medium-Term : SOL has been overall bearish and it is currently trading within the flat wedge pattern marked in red.
📍 As it retests the lower bound of the wedge — which perfectly intersects with the $100 round number — I’ll be looking for short-term longs.
🚀 In parallel, for the bulls to take over in the long term and kick off the next bullish phase, a breakout above the $147 previous daily high is needed.
Which scenario do you think will happen first — and why?
📚 Always follow your trading plan regarding entry, risk management, and trade management.
Good luck!
All Strategies Are Good; If Managed Properly!
~Rich

[Update SOL]: $170-->$75-->$500-->$40?Let's see some boring predictions here based on range trading and Fib extensions...lazy

Solana Rises Over 18% In Last 7 Days as ETF Talks Fuel OptimismSolana has gained strong upward momentum, trading around $130 in the last 24 hours. The token reached a new weekly high, outperforming many altcoins during the broader crypto market recovery. Growing speculation around the possible approval of a Solana Exchange-Traded Fund (ETF) has fueled this bullish movement.
Investor attention turned sharply after Bloomberg ETF analyst James Seyffart clarified that the U.S. Securities and Exchange Commission (SEC) has until October 10 to issue a final decision on the proposed Solana ETF. However, he also pointed out that early approval is still possible, though unlikely. Under the leadership of Paul Atkins and with input from Hester Peirce's Crypto Task Force, the SEC may fast-track decisions related to digital assets.
A Solana ETF could bring institutional capital into the ecosystem, similar to what happened with Bitcoin and Ethereum after their respective ETFs gained approval. Analysts believe that updated regulations, especially regarding asset custody and digital definitions, will be key in shaping the outcome. If progress continues, early approval remains a possibility, although most market watchers still expect a final decision closer to the October deadline.
Technical Analysis
On the chart, SOL has found support at a major demand zone around the $110–$115 range. The price is now trading above this area after reading below $100 at some point, marking an internal bearish break of structure. If the bullish momentum can sustain to trade and close above the recent lower high at around $147, that move would suggest a shift in trend.
If the price fails to maintain momentum and break above $147, bearish momentum will continue, with a potential retest of the support zone below $100.

SOLUSD Technical and Order Flow AnalysisOur analysis is based on multi-timeframe top-down analysis & fundamental analysis.
Based on our view the price will rise to the monthly level.
DISCLAIMER: This analysis can change anytime without notice and is only for assisting traders in making independent investment decisions. Please note that this is a prediction, and I have no reason to act on it, and neither should you.
Please support our analysis with a like or comment!

Abundance of Risk for Bears Now: Bull trap likely. SOL recently hit major supports - ones that I've had my alerts sitting at for a while - see previous bear forecast.
Concurrent to this, we have indices hitting major supports. We have possible completion of the wave 5 part of this downtrend and we're inside the area a head and shoulder would generally form.
The odds strongly favour the bulls in alt now - for the first time in a long time.

$SOL Bullish Engulfing Candle on Weekly CloseBig Bullish Engulfing candle for Solana on the weekly close.
Needs to breakthrough EMA9 and claim as support.
If not, we could see an inverse head and shoulders reversal pattern formed ~$112 before the next leg up.


Solana grows the fastest, will the growth continue ?Marked the important levels in this video for this week and considered a few scenarios of price performance
Local resistance at 135$, local support should be at 115$
Write a comment with your coins & hit the like button, and I will make an analysis for you
The author's opinion may differ from yours,
Consider your risks.
Wish you successful trades! MURA

Sol Getting Ready For Round 3?Sol has made two massive pushes to the upside this cycle followed by a long distribution / re accumulation range. We have not quite seen a full 1/3 retrace of the cycle low but certainly in range to be watching for a momentum shift signaling seller exaustion and new intrest at the lower prices.
Current Trading Plan: DCA until a clear momentum shift occurs and trading rallies.
Targeting same $1000 area as previous long term sol chart posted early this cycle accurately forcasting the current time and range for a major sell off. Now farther in the cycle we can see a simple doubling of the current range and standard cup and handle target aligning for the potential $1000 cycle target.
Trade Well....
Your Friend,
Degen

Canada Approves First Spot Solana ETFs, Launch Set For 16th AprThe Ontario Securities Commission (OSC) has approved the world’s first spot Solana (SOL) exchange-traded funds (ETFs), marking a major step forward for crypto investment products in North America. Beginning April 16, 2025, several asset managers—Purpose Investments, Evolve ETFs, CI Global Asset Management, and 3iQ—will offer direct exposure to SOL on Canadian exchanges.
Unlike derivatives-based products, these ETFs will hold physical SOL tokens, giving both institutional and retail investors a regulated way to invest in the Solana blockchain ecosystem. Each provider will track a separate index, allowing for a range of strategies. In addition, these funds will feature staking options, providing a potential yield advantage over other crypto ETFs.
With this approval, Solana becomes the third cryptocurrency to receive spot ETF approval in Canada, following Bitcoin and Ethereum. The news has sparked increased whale activity and fresh speculation that the United States could follow with its own Solana ETF approvals in the future.
Technical Analysis
Solana’s price has been trading below $150, consolidating within a wider range. The key technical level to watch is $147, which marks an internal structure lower high. A strong break and close above $147 could signal a bullish shift in market structure, potentially triggering upward momentum. On the other hand, if the price fails to close above this level, it may drop below $120, reinforcing bearish pressure.
The ETF launch could become a catalyst for either outcome, depending on how the market reacts to the new inflows. At present, Solana continues to trade just below the critical threshold, awaiting a decisive move as April 16 approaches.

Solana Short Term DowntrendBearish divergence on the hourly RSI. If we close below the uptrend, I see us down to first support which is, in my view, flimsy, so could result in a second leg down to the second support.
Risk profile looks nice relative to the top of the red daily fib-band.
