SOLANA → Pre-breakout consolidation relative to 136.00BINANCE:SOLUSDT relative to the range support forms a false breakdown. The market reacts quite positively and the price recovers, forming a consolidation in front of strong resistance
Bitcoin is also in consolidation, as well as SOL, in general the movements coincide, but lately bitcoin is leading relative to the stock market.
SOL is in consolidation in front of a strong resistance level at 136.00. The primary test may end with a small correction to 0.5 fibo, or consolidation near the level, but a breakout and price consolidation above the current consolidation will be a positive signal for continued growth. The global trend reversal is out of the question, we are aiming at local targets, such as 140, 147, 152.
Resistance levels: 147,152
Support levels: 129, 123, 111
In general, the global market situation is bearish, the local situation is neutral as the price is in a sideways range. A false breakdown was formed against the support of the current range. Technically, due to liquidity imbalance (after the false breakdown) the price may head towards such zones as 147 - 152
Regards R. Linda!
SOLUSDT.3S trade ideas

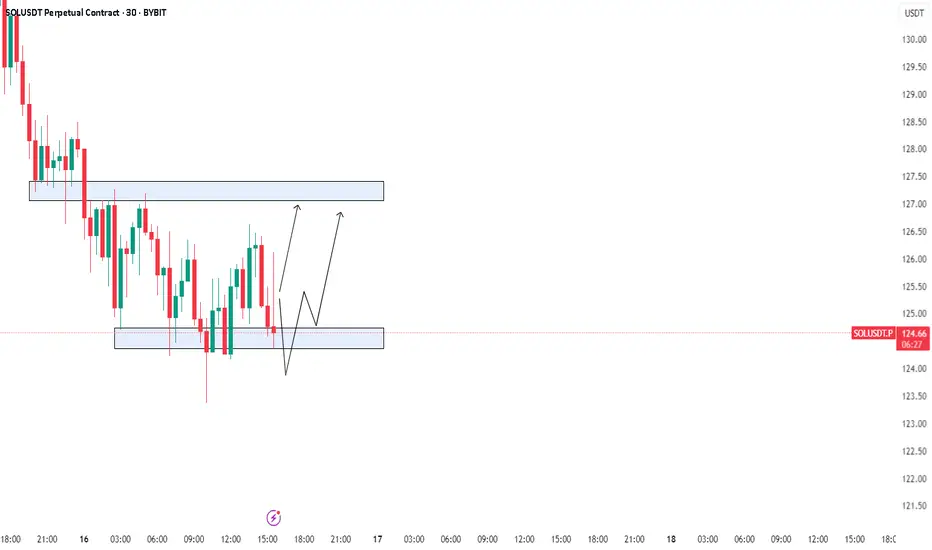
SOL – Small pullback to then grab the liquidity?This 1H chart of SOLUSDT on Bybit showcases a clean bullish continuation setup after a strong impulsive move upward. The current price action suggests a strategic retracement into a high-probability zone of interest before a potential continuation toward buy-side liquidity.
---
1. Market Structure & Context:
- SOL has shifted market structure to the upside following a strong impulse that broke previous lower highs.
- The current pullback resembles a classic bullish retracement, aligning with smart money concepts where price revisits inefficiencies and discount zones before continuation.
- The low on the retracement appears to be forming a higher low relative to the previous structure.
---
2. Fair Value Gap (FVG) + Golden Pocket Zone:
- The blue box represents a clear Fair Value Gap created during the recent rally — a price imbalance often targeted for entries by institutions.
- Overlaying that zone is the Fibonacci golden pocket (0.618–0.65), a highly reactive retracement area in bullish moves.
- The confluence of FVG and the golden pocket makes this a powerful demand zone, supported by historical order flow behavior.
---
3. Fibonacci Levels & Price Action:
- 0.618–0.65 zone: Ideal entry region during bullish retracements. Price is currently reacting within this band.
- 0.786 level: A deeper retracement level that still supports bullish continuation if respected — though it marks the edge of the current FVG.
- The equilibrium between these levels represents a discount area for accumulation.
---
4. Liquidity Outlook – Buy-Side Liquidity (BSL):
- A clear BSL (Buy-Side Liquidity) sits above the previous local high.
- Price is likely to target this level as the next point of liquidity collection once the retracement completes.
- The green arrowed path shows the anticipated flow: a short-term dip into the FVG before a bullish move to sweep the BSL.
---
5. Trade Narrative:
- This setup reflects an entry based on optimal trade theory — retracement into a zone of inefficiency and discount (FVG + golden pocket).
- Bullish continuation is expected if this zone holds, especially with confluence from market structure and resting liquidity overhead.
- Ideal confirmation may involve lower timeframe bullish breaks of structure inside the FVG.
---
Summary:
SOL is offering a textbook retracement setup on the 1H, with price pulling back into a confluence of a Fair Value Gap and golden pocket (0.618–0.65). If the zone is respected, the next likely destination is the buy-side liquidity resting above previous highs. The reaction within this area will be key to validating the bullish scenario.

SOLUSDT Breakdown WarningYello Paradisers! Have you spotted what’s happening with SOLUSDT right now? A major breakdown just played out, and this could be the beginning of a much deeper bearish move that many are underestimating.
💎SOLUSDT has broken down from a rising wedge pattern—an important bearish structure that often signals upcoming downside pressure. Before the drop, it swept liquidity, a typical smart money move, and has now confirmed a bearish Change of Character (CHoCH). This combination significantly increases the probability of further decline.
💎If we see a pullback into the resistance zone—it could offer a strong short opportunity with good risk-to-reward ratio. That’s where professional traders start looking to position themselves carefully.
💎However, this bearish idea has a clear invalidation point. If price breaks out and closes a candle above that invalidation level, then the bearish outlook becomes void. In such a case, it’s wiser to stay patient and wait for more precise, high-probability setups to develop.
🎖Strive for consistency, not quick profits. Treat the market as a businessman, not as a gambler. Stay disciplined, Paradisers, and wait only for the cleanest, most reliable trading opportunities. That’s how you make it in this game.
MyCryptoParadise
iFeel the success🌴

#SOLUSDT: Price to turn extreme bullish! Get ReadyHey there everyone! 👋
I’ve got some updates on the BINANCE:SOLUSDT price. It’s been testing a crucial level, and it’s showing some really strong bullish signs and patterns. But here’s the thing, we’re starting to think there might be a possible reversal coming up in the next few days. If we’re right, the price could hit all three targets we’ve been tracking.
Remember, though, that this is just our analysis, and it’s always a good idea to use accurate risk management when you’re trading.
Thanks for your support! 😊
If you want to help us out, here are a few things you can do:
- Like our ideas
- Comment on our ideas
- Share our ideas
Team Setupsfx_

SOLANA I Monthly CLS I KL - OB I Model 1 , Target 50% than CLSHey, Market Warriors, here is another outlook on this instrument
If you’ve been following me, you already know every setup you see is built around a CLS range, a Key Level, Liquidity and a specific execution model.
If you haven't followed me yet, start now.
My trading system is completely mechanical — designed to remove emotions, opinions, and impulsive decisions. No messy diagonal lines. No random drawings. Just clarity, structure, and execution.
🧩 What is CLS?
CLS is real smart money — the combined power of major investment banks and central banks moving over 6.5 trillion dollars a day. Understanding their operations is key to markets.
✅ Understanding the behaviour of CLS allows you to position yourself with the giants during the market manipulations — leading to buying lows and selling highs - cleaner entries, clearer exits, and consistent profits.
🛡️ Models 1 and 2:
From my posts, you can learn two core execution models.
They are the backbone of how I trade and how my students are trained.
📍 Model 1
is right after the manipulation of the CLS candle when CIOD occurs, and we are targeting 50% of the CLS range. H4 CLS ranges supported by HTF go straight to the opposing range.
📍 Model 2
occurs in the specific market sequence when CLS smart money needs to re-accumulate more positions, and we are looking to find a key level around 61.8 fib retracement and target the opposing side of the range.
👍 Hit like if you find this analysis helpful, and don't hesitate to comment with your opinions, charts or any questions.
⚔️ Listen Carefully:
Analysis is not trading. Right now, this platform is full of gurus" trying to sell you dreams based on analysis with arrows while they don't even have the skill to trade themselves.
If you’re ever thinking about buying a Trading Course or Signals from anyone. Always demand a verified track record. It takes less than five minutes to connect 3rd third-party verification tool and link to the widget to his signature.
"Adapt what is useful, reject what is useless, and add what is specifically your own."
— David Perk aka Dave FX Hunter ⚔️

Solana SOL Reveals The Manipulator's Plan!Hello, Skyrexians!
It's time to update BINANCE:SOLUSDT analysis. We have already told about Solana dump when price was next to $300 where told about $110 and as usual did not count last wave, but anyway bounce from this area was anticipated. What is next?
Recent top was the wave 5 of higher degree, we have shown it many times, today no need to do it again. Now asset is in ABC correction. Wave A was 5 waves shaped. Last wave has been finished with the green dot on the Bullish/Bearish Reversal Bar Indicator and now we are in the wave B. It has the target at 0.5-0.61 Fibonacci which is somewhere next to $200. From there we expect the huge crash below $90 in the wave C. Solana potential dump is not cancelling potential altseason on OTHERS.D because it's in top-10 crypto cap assets. May be it's time to transfer money from overvalued SOL to undervalued crypto?
Best regards,
Skyrexio Team
___________________________________________________________
Please, boost this article and subscribe our page if you like analysis!

Long trade
15min TF overview
📅 Trade Log Entry
Pair: SOLUSDT
Date: Sunday, April 20, 2025
Time: 4:30 PM (NY Time)
Session: New York PM
Entry 136.068
Profit level 137.391 (0.97%)
Stop level 136.023 (0.03%)
RR 29.4
📊 Trade Setup – Buyside Idea
🧠 Strategy Components:
Volatility Zones Identified:
🔹 White: Resistance zone
🔹 Green: Support zone
🔹 Yellow: Midpoint (key POI)
Liquidity Sweep: Price swept below support capturing liquidity before reversing.
Order Block & Choch: Institutional buy zone confirmed with a bullish change of character.
Break of Midpoint (Brk): Confirmed directional bias following midpoint breakout.
30sec TF overview

Solana Is One Breakout Away From a Bullish Explosion!Yello, Paradisers! Did you notice how #SOLUSD has been quietly positioning itself while the rest of the market remains uncertain? If you're not paying attention right now, you could be missing one of the cleanest setups on the charts.
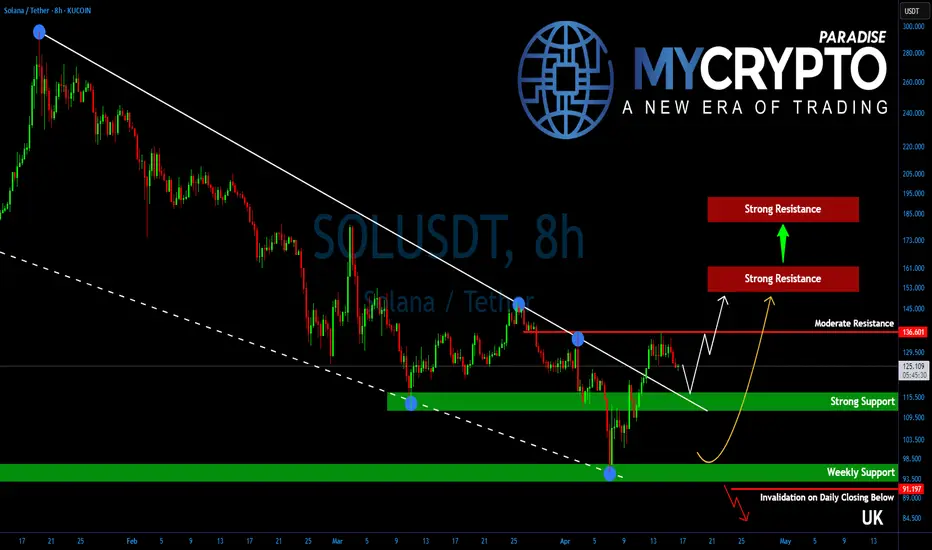
💎After several weeks of downside grind and tight consolidation, Solana has just broken out of a falling wedge—a powerful bullish pattern that typically signals trend reversals or the start of a strong upside leg. This breakout wasn’t random either. It occurred after SOL successfully defended a key higher time frame support zone, signaling strength behind the move.
💎For #SOLUSDT, all eyes are on the $136.50 resistance level. This is a critical structural pivot. A clean break and close above this level would confirm a shift in higher time frame momentum from neutral to bullish. Until that happens, bulls still need to proceed with caution—but the setup is clearly developing in their favor.
💎Adding conviction to the idea of a bullish breakout are several supporting factors. Oscillators are showing bullish divergences, a classic sign that seller momentum is fading. At the same time, a golden cross formation on the 12-hour chart is getting closer which typically precedes sustained trend reversals and stronger moves to the upside.
💎If bulls succeed in reclaiming $136.50, the next price targets are $155–$160 as the initial strong resistance zone where some profit-taking could occur. If bulls hold strength, SOL is likely to head further higher and aim for $180–$190, which lines up with the target of the wedge pattern. This is a strong resistance zone and a level which could mark end of the corrective phase for Solana.
💎On the downside, immediate support lies between $110–$115. This is a well-defined range of demand and should offer strong buying interest if any short-term pullbacks occur.
Paradisers, strive for consistency, not quick profits. Treat the market as a businessman, not as a gambler.
MyCryptoParadise
iFeel the success🌴
SOL/USDT:SIGNALHello friends
According to the price growth we had, you can see that the price is in a range and now, as it approaches the ceiling of the range, if it manages to break our channel, it can move to the specified targets.
*Trade safely with us*

Give me some energy !!!The price has broken the wedge, and in my opinion, it could form a head and shoulders pattern before experiencing significant growth.
Give me some energy !!
✨We spend hours finding potential opportunities and writing useful ideas, we would be happy if you support us.
Best regards CobraVanguard.💚
_ _ _ _ __ _ _ _ _ _ _ _ _ _ _ _ _ _ _ _ _ _ _ _ _ _ _ _ _ _ _ _
✅Thank you, and for more ideas, hit ❤️Like❤️ and 🌟Follow🌟!
⚠️Things can change...
The markets are always changing and even with all these signals, the market changes tend to be strong and fast!!

Trading opportunity for SOLUSDTBased on technical factors there is a Sell position in :
📊 SOLUSDT
🔴 Sell Now
🪫Stop loss 151.00
🔋Target 97.00
📏 R/R 2
💸RISK : 1%
We hope it is profitable for you ❤️
Please support our activity with your likes👍 and comments📝

SOLUSDT soon again 200$We are looking for rise and pump here like the green arrows mentioned on the chart also we can consider new Head & Shoulders pattern which is cooking here and it can easily reverse market and stop it from more fall and then next phase of pump would be ahead to the targets like 200$.
Also two major daily supports now are extremely strong and can stop price from fall and these supports are 115$ & 80$.
DISCLAIMER: ((trade based on your own decision))
<<press like👍 if you enjoy💚

Global Market Overview. Part 4.2: SOLANA
Solana: The American Blockchain Making a Comeback
(Previous post: )
Continuing from everything I’ve written earlier about Bitcoin and Ethereum, Solana deserves a separate spotlight.
Because this asset is a different story altogether. It’s not like Bitcoin. It’s not like Ethereum.
Solana has its own path, its own logic — and most importantly, its own market cycle, which follows a very different pattern of growth.
Why did Solana rally?
Let’s be blunt: Solana isn’t just a blockchain — it’s the epicenter of the new crypto cycle, where the main drivers weren’t decentralization or institutional capital, but memes, hype, and community.
Thousands of new tokens launched on Solana became the spark behind an explosion of interest.
The network surged with activity, and it was that real usage — not marketing — that pushed market cap higher.
But that’s not all.
Solana is Made in the USA.
And in crypto, just like in politics, that matters.
An American project, developed on U.S. soil, Solana quickly gained the trust of the largest and wealthiest crypto investor base in the world — American investors.
To be precise: it was the U.S. crypto community that pushed Solana into the mainstream.
And once funds and OTC brokers joined the party, it became clear — this asset isn’t going anywhere.
What about fundamentals?
Peak price: nearly $300
Growth from 2021 to 2024: one of the fastest in crypto
Network load: consistently high
Number of projects in the ecosystem: growing
Confirmed approval for a Solana ETF in the U.S.
Technological flexibility and strong developer support
U.S. jurisdiction: trusted by both institutions and retail
Why didn’t it crash with the rest of the market?
Here’s the twist: even as the crypto market was rocked by negative news and broad corrections, Solana held above $100.
That’s a key support level — and it held up under pressure from:
Trump’s tariff panic
Futures market liquidations
Capital outflows from other altcoins
Rising Bitcoin dominance
Yes, the price pulled back to the $130–140 range, but it never broke major support — a clear sign that strong hands haven’t let go.
But why hasn’t it gone higher if things are so good?
Simple: the Solana ETF hasn’t officially launched yet.
But once formal approval from the SEC is in place — the asset is set to explode.
We already saw a pump above $200 just on rumors.
Now the clock is ticking — when will rumor become reality?
And here’s a spoiler: the Solana ETF has already been approved.
In crypto, that’s how it goes — first the whispers, then insider info leaks, then the price runs.
And finally, when the official news drops — that’s when the real move starts.
We haven’t seen that final leg yet because of all the macro confusion over tariffs.
What’s next?
I’m not giving financial advice.
But here’s the reality — I bought Solana on the dip and I’m still buying.
Why?
Because I need to recover the $300K I lost on Ethereum
Because everything points to a continuation of the bull trend
Because no other major asset offers this kind of symmetry between fundamentals and upside potential
Solana isn’t a bubble.
It’s a trading platform for the meme economy — and one of the few blockchains where actual demand matches real scalability and low fees.
And in crypto, that means a lot.
My personal take
If you’ve got free cash right now — don’t be afraid to look Solana’s way.
I see no reason to fear this asset in the medium to long term.
The network is alive. The network is growing. The asset is holding strong.
Now all we need is the next trigger — and it will come.
The potential to see $200 again in the coming months?
Very real.

Elliott Wave Update – Structure OverviewBINANCE:SOLUSDT
We may have found a potential local bottom at yellow Wave A, and are now tracking a move towards yellow Wave B.
This yellow Wave B appears to be unfolding as a 1-2-3-4-5 structure:
Waves 1-2-3 are likely completed.
Waves 4 and 5 could still be ahead.
This full impulse may form part of a larger A-B-C correction, completing the final yellow Wave B.
In the black wave count, the 1-2-3 move is finished.
Within Wave 3, we saw a clean internal 1-2-3-4-5, confirming the completion of that wave.
Currently, I’m tracking the move from black Wave 3 to black Wave 4 as a developing A-B-C correction:
Wave A is potentially in.
We are now in the resistance zone of Wave B, which could lead to the final drop into Wave C.
After completing Wave 4, I expect an upward move into black Wave 5, starting with an initial A-wave.
This should then form another A-B-C structure, leading to the completion of the final yellow Wave B.

Solana (SOL): Re-Testing Resistance Zone | Sell Opportunity!Solana has reached the major resistance zone where it is retesting the recently broken zone, which will determine the next bigger movement of the coin. We are seeking to see an MSB to fulfill properly, which can lead the price to dip another 22%.
More in-depth info is in the video—enjoy!
Swallow Academy

Solana vs Ethereum – A Meme War or Market Shift?🔥⚔️ Solana vs Ethereum – A Meme War or Market Shift? 🧠📉
It’s getting spicy out here in the crypto arena... and the memes are hitting just as hard as the market caps! 💥
Over the weekend, Solana briefly flipped Ethereum in total staking value — triggering a fiery debate on whether that’s bullish or bearish for SOL. Some celebrated the milestone 🥂, while others, especially from the ETH camp, argued it reveals a deeper problem: Solana’s staking isn't really staking (as slashing isn’t automatic, and network restarts are still a thing). 🛑🔧
📸 Bonus Meme: Apparently Ethereum’s new logo is now Internet Explorer 😂 — can’t say the UX didn’t earn it.
🧠 The FXProfessor’s Technical Take: Let’s cut through the noise.
📉 SOLETH (Solana vs Ethereum Ratio)
Rejected at grand resistance: 0.088
Projected drop: -28% to 0.063
Structure: Bearish inside an ascending channel (highlighted in orange)
📊 ETHUSD
Support: $1,530
Rebound potential: $1,650 and beyond
Long-term structure still forming — this could be a spring.
📈 SOLUSD
Key support: $114
If that breaks higher, next test is $179, then $215
But failure at this level opens room for downside re-test near $80
💬 So where do we stand? On chart structure alone, Solana might still outperform ETH short-term — but technically, SOLETH suggests a correction is due.
🧑🏫 Yes, I’m emotionally attached to Ethereum — I have build on it, invested in it, got smashed on it for months..pain, at least for now. But I trade what I see (or at least i try damn it!)
Let the memes roll, but let the charts speak. Drop your thoughts — SOL or ETH? 👇
One Love,
The FXPROFESSOR 💙

SOLANA POC Resistane, another Lower High ?Solana rallied from sub-$100 support but is now facing heavy resistance near $149 — a level packed with technical confluence. The move up has been met with declining volume, and early signs of rejection are already surfacing on the lower time frames.
Key Points:
Price tapped the 2024 point of control at $149, overlapping with VWAP and the 0.618 Fibonacci.
Volume remains weak, signaling potential exhaustion in the current bounce.
Unless bulls reclaim $149 convincingly, this area is likely to act as a ceiling, pushing Solana back toward the value area low at $113 or even a retest of the $100 daily support. A breakdown below $113 could accelerate the move lower, so this remains a key swing level to watch.

SOL - Some new TA- IO and CVD increased regarding last highs (15.04.) but price has not broken Local Daily line. This means Big Money is shorting the Local Daily and absorbing Longs.
- Price is going up while Volume (OBV and AD) is decreasing in almost every time frame. Again. Big money is selling heavily to the Longs. The probability that Whale Sellers get exhausted is high too!
- 1H:
Grey line would be a nice Short if we can catch it.
Price on 0.78 Fib.
Risky...
1H Chart :
Follow for more ideas/Signals.💲
Just donate some of your profit to Animal rights or other charity :)✌️

Short trade
📉 Sell-side Trade – SOL/USDT
📅 Date: Sunday, April 20, 2025
⏰ Time: 4:00 AM (NY Time) – London Session AM
🕓 Structure: 4Hr Timeframe
🎯 Target: Liquidity low
Trade Details:
Entry: 137.133
Take Profit (TP): 133.559 (–2.61%)
Stop Loss (SL): 137.275 (+0.10%)
Risk-Reward Ratio (RR): 22.17
"This is a refined supply zone rejection, with the 4-hour structure aligning for a liquidity sweep, confirming a sell-side trade setup." and following early executed sell side trade.
15min FT overview.

Brace for a 10% drop on solana (just the beginning…)No drama — just charts.
Solana’s hanging around $136, but don’t let the calm fool you.
We’ve already seen Break of Structure (BoS) and Change of Character (ChoCH) — structure has shifted.
Now I’m watching:
🔹 FVG starting at 135.7 (136 good choice)
🔹 Order Block between 137.0 – 138.5
This is where the first leg of the drop begins.
Short-term target: $125
That’s about a 9% move — but this is just the beginning.
I expect a much deeper move to follow — but for now, this is the setup worth tracking.
Status: Setting up
Confidence: High
Timing: Imminent
The Wolf is watching.
You’ve been warned.
– Alpha Sigma Wolf
“Not all howls are warnings. Some are confirmations”
#Solana #SolanaShort #CryptoTrading #TechnicalAnalysis #SmartMoneyConcepts #FVG #OrderBlock #AlphaSigmaWolf #TheWolfSees #WolfOfCrypto #PriceAction #ChoCH

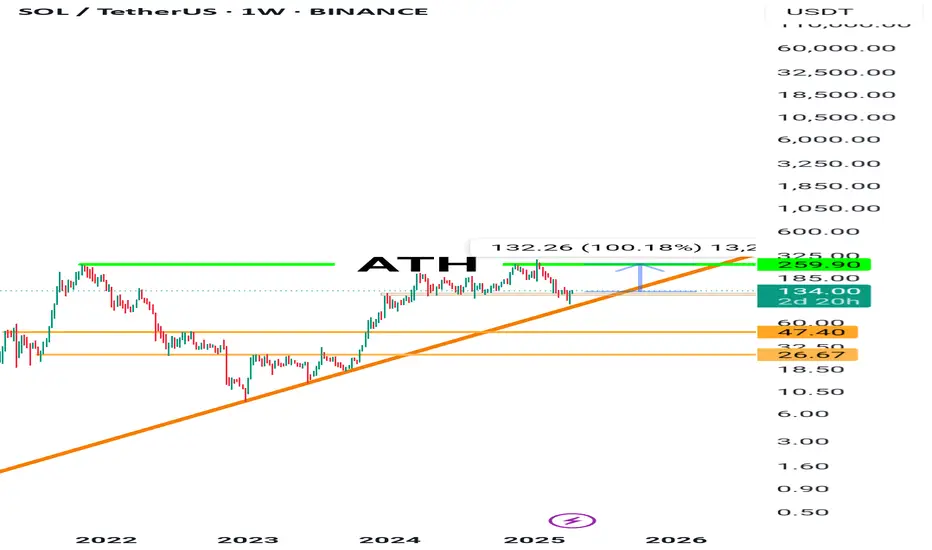
$SOL Weekly Bounce from Dynamic Support – Watch for BreakoutCRYPTOCAP:SOL is holding above a key rising trendline that has acted as strong support since 2021. After a successful retest near $95–$100, SOL bounced sharply and is now trading above $120.
This move also confirms a reclaim of a previous resistance-turned-support zone. As long as it holds, SOL could aim for $145 and above.
DYOR, NFA

SOL/USDT Ranging and ranging...The price is overall in sell trend and since the candle here made a big wick to the upside theres a chance of another fakeout....now i dont believe the market will just turn around but i am sure that since its a sell range that its possible it will come back for another touch to the upside sooner or later.