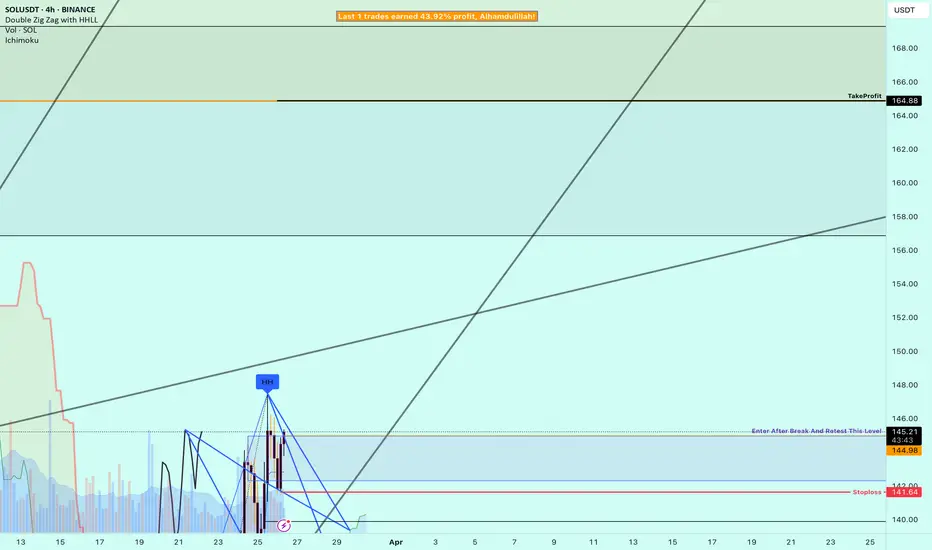
SOL/USDT Price Movement for buy?The price stopped falling and making LL's....and showed HH's and a strong buy movement. There is actually a pretty noticable buyers movement that started since the price has only been rising but we need to be carefull because we are in a sell overall and there is a fakeout that happened at the upper GWS zone.
SOLUSDT.3S trade ideas

sol buy midterm"🌟 Welcome to Golden Candle! 🌟
We're a team of 📈 passionate traders 📉 who love sharing our 🔍 technical analysis insights 🔎 with the TradingView community. 🌎
Our goal is to provide 💡 valuable perspectives 💡 on market trends and patterns, but 🚫 please note that our analyses are not intended as buy or sell recommendations. 🚫
Instead, they reflect our own 💭 personal attitudes and thoughts. 💭
Follow along and 📚 learn 📚 from our analyses! 📊💡"

SOLUSDT BuyBullish signal on Solana H4 chart. Price is already outside of triangle pattern. Now market wants to creat new consolidation 138 - 145 levels. Risk reward 1/3


1 Year "OLD" accumulated SOL VS "NEW" Pre 04.NOV.2024 OnwardsNEW SOL Move?
Sweet spot to be for long term investor - depending how long plan is to "park". 6 Months - OK?
If No pandemics, wars etc, "good" usual Q4 - great place to be while checking on situation in Moonvember / December 2025. Ideal time to harvest.

SOL buy/long setup (4H)In the hourly timeframes, bullish signals are visible on the Solana chart.
The trigger line has been broken. Bullish (ICH) is present on the chart. Higher lows (L) are forming.
We are looking for buy/long positions in the demand zone.
A 4-hour candle close below the invalidation level will invalidate this analysis
Do not enter the position without capital management and stop setting
Comment if you have any questions
thank you

solusdt.p 4hHello trading lovers
In the image you see, the price has made the third contact with the trend line and should move according to the same scenario you see
The profit limit of this position is the price touching the red line (pullback line) and the Saudi trend continues again
Good luck and be victorious.

SOL: Key Support Zone and Bullish Potential: Targeting New HighsSOL: Key Support Zone and Bullish Potential: Targeting New Highs
SOL recently tested a robust support zone near 112, which aligns with a significant structural level on the daily chart. This zone, originating from the left side of the structure, has demonstrated its strength over the past year.
Historically, this area has been tested multiple times, consistently acting as a strong support. It has also been the origin of several aggressive price movements in the past year, underscoring its importance.
Currently, SOL shows promising signs of a potential rise, having completed another bullish wedge pattern.
The target zones I am monitoring for this upward movement are 146, 160, and 177.
You may find more details in the chart!
Thank you and Good Luck!
❤️PS: Please support with a like or comment if you find this analysis useful for your trading day❤️

#SOL: Capitalizing on High-Speed DeFi & NFTs
Description:
This trading idea focuses on SOL, the native cryptocurrency of Solana, a high-performance blockchain known for its speed, low transaction costs, and scalability. SOL powers a rapidly growing ecosystem of DeFi applications, NFT marketplaces, and Web3 innovations. With its ability to process thousands of transactions per second, Solana has positioned itself as a strong competitor to Ethereum, attracting developers and institutional interest. The network’s continuous expansion in gaming, decentralized applications, and tokenized assets further strengthens SOL as a key player in the crypto space.
Despite its strong fundamentals, it’s crucial to acknowledge that SOL, like all cryptocurrencies, remains highly volatile and subject to external influences such as market sentiment, regulatory developments, and macroeconomic trends. Investors should carefully assess the risks before entering any position.
Disclaimer:
This trading idea is provided for educational purposes only and should not be considered financial advice. Trading cryptocurrencies like SOL involves significant risk, including the possibility of losing your entire investment. Always conduct thorough research, assess your financial situation, and consult with a financial advisor before making any investment decisions. Past performance is not indicative of future results.
SOL up to 300$I hope you are ready for a $300 flight before the new year. I would expect a hike to the 1.618 level and a powerful breakout soon.

SOL - its not just a SOL!Thats SOL, The ORange shall likely happen when market falls to the block, Somehow if vol comes on the OB, the red arrows what shows, takes place.However, more pressure leads to the fall till 128, but from rage 135 to 129 is the best buys to 167, even 178 as well!!

sol for your soulSOL retraced back to strong support, held well. so my sentiment have switched to bullish untill im infomed otherwise
nice quick pofit with a tigh stop loss

$SOL – Will the Breakout Happen? 4HTF---1DTF
Solana (SOL) is showing strength after **bouncing off ascending channel support** and is now approaching a critical resistance level. A breakout here could trigger the next bullish move.
SOL Daily Update:
- Rebounding from channel support, regaining bullish momentum.
SOL 4H Update:
- Retesting trendline resistance at the upper boundary.
- **Key level to watch:** A breakout above **$148** could fuel the next leg up.
Momentum is building—watch for confirmation at resistance! 🚀

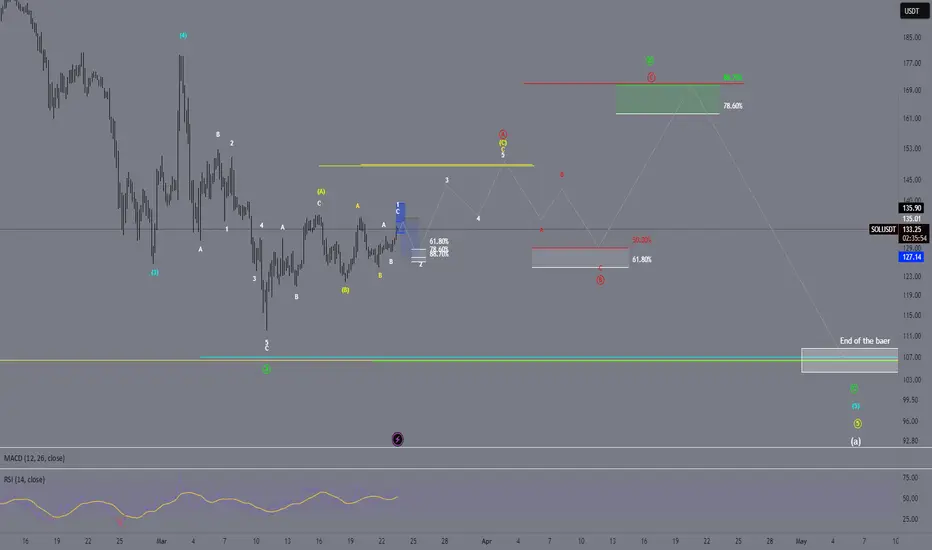
SOLUSDT Elliott Wave Analysis – Potential ScenariosMEXC:SOLUSDT
📌 Current Wave Structure:
We are currently in an impulsive upward move, which appears to be Wave (3).
The recent pullback can be interpreted as an ABC correction within Wave (4), reaching nearly the 88.7% retracement level.
📌 Potential Scenarios:
1️⃣ Short-Term: Further corrective movement downward (potential Fibonacci retracement of 38-50% for Wave (4)).
2️⃣ Mid-Term: A continuation of the upward move towards the $170-$175 target zone, marking the completion of Wave (5) and possibly the entire larger structure (C).
3️⃣ Long-Term: After Wave (5) concludes, a significant corrective move could follow.
⚠️ Key Levels to Watch:
🔹 Support: $140.30 / $133.45
🔹 Resistance: $146.49 / $170.41
📊 Conclusion:
If the correction plays out within the expected Fibonacci zones, this could present an attractive long setup for Wave (5). However, a larger corrective move might follow afterward.
What are your thoughts? Feel free to share your analysis and opinions! 📉📈

Solana (SOL) Elliott Wave Analysis – Potential Roadmap for UpcomMEXC:SOLUSDT
Overview:
This analysis examines Solana’s current Elliott Wave structure. The chart suggests a potential correction (blue zone), followed by a strong upward impulse (Wave 3), and later a larger ABC corrective phase (red letters) before potentially resuming a bullish trend.
1. Short-Term Scenario (Blue Zone)
- Complex Correction: The price has recently undergone a multi-wave correction and is approaching a potential buying zone.
- Fibonacci Levels: Zones around 61.8% and 78.6% may act as support levels where the correction could end.
- Entry Opportunity: If the price tests these levels and shows signs of forming a base, this could be a favorable entry point.
2. Next Upward Impulse (Wave 3)
- Strong Move: Once the correction concludes, an impulsive upward movement (Wave 3) could kick off, typically the most dynamic leg in an Elliott Wave cycle.
- Target Area: The highlighted yellow zone in the chart indicates a key resistance level that the market could aim to hit.
3. Mid-Term ABC Correction (Red Waves)
- After the Impulse: Once the impulsive upward move (Wave 5) completes, a larger ABC corrective phase is expected (denoted by red letters).
- Retracement Levels: Fibonacci retracement levels around 50% or 61.8% may serve as critical support zones during this correction.
4. Long-Term Perspective
- Renewed Bullish Trend: Following the completion of the ABC correction, there is the potential for Solana to resume its bullish trajectory.
- Target Zone: The green area in the upper section of the chart represents a possible long-term resistance or target level where a significant market decision could take place.
Conclusion:
- Short-Term: A correction toward the blue zone is possible, which may offer a good entry opportunity if support holds.
- Mid-Term: A robust upward impulse toward the yellow resistance is anticipated, likely followed by a larger ABC correction.
- Long-Term: Once the correction completes, Solana could resume an upward trend, setting the stage for a new bullish phase.
- Disclaimer: This analysis is for educational purposes only and should not be considered financial or investment advice. Always practice proper risk management when trading.
SOL/USDT Trade 3SOL/USDT
Asset has an ascending triangle on 4 hour , successfully broke out of it , hoping for pullback to previous resistance for entry for long position. Stoploss under previous resistance which I am hoping will become support. Target at recent swing high.
Entry – 135.96
Stoploss – 129.86 (-4.5%)
Take Profit – 179.7 (32.1%)
RR: 7.2

A mini dip for solSeems sol needs a small dip to create a double bottom. Seems this 120-140 is a nice floor.

solusdt analysis and trade idea.SOLUSDT is trading at 142$ and has done bullish BOS after MSS as mentioned on the chart. As bullish BOS has done so we have to look for long entries in below that BOS move that caused BOS. I have found one FVG where i will look for long entries.

Plan for Solana for this weekMarked important levels for this week
Which coin should I analyze next ?
The author's opinion may differ from yours,
Consider your risks,
DYOR.

Strong Reasons Why Solana will Rise Above $140 LevelSolana (SOL) is currently trading around $140, showing an upward trend since October 2023. Analysts predict that the next key target price for SOL is around $294. Several factors within the Solana network, along with broader crypto market trends, are driving this recovery.
On March 24, SOL gained 8.5%, briefly surpassing $142. This price increase aligned with a general market rally, as traders became more optimistic about economic conditions. Memecoins also surged, with some gaining over 12% since March 23, showing a growing risk appetite among investors.
Apart from market-wide movements, Solana has unique strengths fueling its rise. One major factor is increased activity on its blockchain. Additionally, former U.S. President Donald Trump's involvement in the memecoin market has sparked further interest. Moreover, anticipation of a spot Solana exchange-traded fund (ETF) has attracted top traders, suggesting SOL could see more gains ahead.
Despite this, SOL has underperformed compared to the overall crypto market by 23.7% over the past two months. One reason is the sharp decline in network fees, which dropped by 93% in that period. This decrease started when traders lost interest in memecoins, but it later spread across Solana's decentralized applications (DApps).
Currently, SOL is still 52% below its all-time high of $295. However, many traders believe the selloff might have been excessive. Solana remains the second-largest blockchain in terms of total value locked (TVL) and ranks third in on-chain transaction volumes. In comparison, Binance Coin (BNB) is down 20% from its peak, and XRP is 28% below its all-time high.
Solana’s competitors, such as Tron and BNB Chain, also have strong on-chain activity. However, Solana’s smart contract deposits are valued at $6.8 billion, making it one of the leading networks. In contrast, BNB Chain holds 21% less TVL, with $5.4 billion. Solana’s key projects, such as Jito (a liquid staking solution), Kamino (a lending and liquidity platform), and Jupiter (a decentralized exchange), continue to support network activity.
Another positive sign is the increase in Solana’s transaction fees. The network now generates more than $1 million in daily fees, surpassing Ethereum’s base layer. Recently, Solana’s revenue hit its highest level in two weeks, suggesting the market downturn might have bottomed out.
Ethereum, by comparison, collected under $350,000 in fees on March 23. As a result, its supply increased because its burn mechanism could not offset weak blockchain activity. Meanwhile, Solana offers a 7.7% native staking reward, outpacing its 5.1% inflation rate, making it attractive to long-term holders.
Another driver of SOL’s recent momentum is speculation about a Solana ETF. The U.S. Securities and Exchange Commission (SEC) is expected to decide on this by the end of the year. If approved, a spot Solana ETF could legitimize the asset, especially among institutional investors.
Additionally, a recent social media post by Donald Trump mentioning the TRUMP memecoin sparked a wave of excitement. In response, several Solana-based memecoins saw double-digit gains, including Fartcoin (up 15%), Dogwifhat (up 12%), and Pudgy Penguins (up 12%).
Overall, SOL’s price outlook remains promising, supported by strong network activity, rising fees, and bullish sentiment from top traders.

solusdt.p 4hHello analyst friends
On the four-hour timeframe in Solana, according to the logarithmic lines, this scenario you see in the image should occur
Enter the position with the confirmation of the candle and the support and resistance levels
I would like you to follow me.

SOL/USDT Projections on one Hour ChartSol/USDT is showing an uptrend on one hour time frame with no divergence as yet.
The entry point, SL and TP1 are given on the chart for taking trades .

SOL/USDT: UPDATE SIGNALHello friends
You can see that after the price fell in the specified support area, buyers came in and supported the price and made a higher ceiling.
Now we can buy at the specified levels with capital and risk management and move with it to the specified targets.
*Trade safely with us*
