$SOLUSDT likely to retrace for a bigger bullish move!!!BINANCE:SOLUSDT looks like it is running out of steam as it approaches a major resistance. In the coming weeks, BINANCE:SOLUSDT is expected to retrace back to a minor support and resistance zone (marked out in the chart) where it will gain reasonable momentum for a bigger pump to at least $260 and above. Be on the lookout.
Kindly support this analysis to enable it reach to other people, and do comment your thoughts.
SOLUSDT.3S trade ideas

Long Trade
15min overview
30sec TF entry
🟩 Buyside Trade Idea
📈 Pair: SOL/USDT
🏷️ Type: Intraday | LND Session AM
🧠 Setup: Breakout + FVG + Demand Flip
📅 Date: Sunday, 11th May 2025
🕟 Time: 4:30 AM
🔹 Entry Price: 172.632
🔹 Profit Target: 180.249 (+4.41%)
🔹 Stop Loss: 172.260 (-0.22%)
🔹 Risk-Reward Ratio: 20.00
🔍 Reasoning:
Confirmed buyside directional bias following a break of trendline liquidity. Consecutive Fair Value Gaps (FVGS) formed during upward movement, showing consistent institutional flow. A former supply zone flipped to demand, and the prior consolidation phase has been mitigated, providing confidence in a continuation toward higher liquidity zones.
📌 Status: Planned
5min TF overview

#SOL/USDT#SOL
The price is moving within a descending channel on the 1-hour frame, adhering well to it, and is on its way to breaking it strongly upwards and retesting it.
We are seeing a bounce from the lower boundary of the descending channel, this support is at 172.
We have a downtrend on the RSI indicator that is about to break and retest, which supports the upward trend.
We are looking for stability above the 100 moving average.
Entry price: 173
First target: 176
Second target: 180
Third target: 183

SOLUSDT | Long Bias | Healthy OI | (May 12, 2025)SOLUSDT | Long Bias | Healthy OI + Spot Demand Rising | (May 12, 2025)
1️⃣ Short Insight Summary:
Solana is showing strength with open interest rising alongside spot price—a sign of real buyer demand, not just leverage-driven moves. The setup leans bullish, and shorting here would be risky.
2️⃣ Trade Parameters:
Bias: Long
Entry Zone: Around $144
Stop Loss: $116 (wider SL for structure protection—not for scalping)
TP1: $155
TP2: $178
TP3: $207
Final TP: $288
Partial Exits: Strongly recommended at each target to lock in gains and reduce risk
3️⃣ Key Notes:
✅ Open interest and spot price are both increasing—a sign of healthy demand.
✅ This isn't a time to fight the trend. Probability favors longs here.
❌ Shorting would feel like handing free money to the market—smart risk management is key.
✅ We're not looking to overtrade this—treating it like a swing setup with structure-based levels.
✅ Keep an eye on correlated plays—like the equity Hotel, which is to Solana what MicroStrategy is to Bitcoin. If Solana rallies to $500 (which is optimistic, but possible), names like Hotel could benefit heavily.
4️⃣ Optional Follow-up Note:
I’ll be tracking this trade zone closely and will update if anything major changes in price structure or momentum.
Please LIKE 👍, FOLLOW ✅, SHARE 🙌 and COMMENT ✍ if you enjoy this idea! Also share your ideas and charts in the comments section below! This is best way to keep it relevant, support us, keep the content here free and allow the idea to reach as many people as possible.
Disclaimer: This is not financial advice. Always conduct your own research. This content may include enhancements made using AI.

SOL LONG AND SHORT OPPERTUNITYSOLUSDT chart shared with 4h time frame analysis, I am expecting price to go slightly up to invite late FOMO longers and then come down to hunt their stop losses, when price will come down and hunt stop losses of LONG traders then they will try to enter Short but here I am expecting price to come and fill SSL and FVG and then go LONG and target buy side liquidity and supply zone. This is my plan.

SOLUSDT UPDATE
Pattern: Falling Wedge Breakout
Current Price: \$173.38
Target Price: \$300
Target % Gain: 105.90%
Technical Analysis: SOL has broken out of a falling wedge pattern on the daily chart, indicating a bullish reversal. Strong momentum and breakout confirmation suggest a potential move towards the \$300 level.
Time Frame: 1D
Risk Management Tip: Always use proper risk management.

HolderStat┆SOLUSD bullish channel points higherAfter a consolidation base, SOL launched into a growing ascending channel. As long as price respects the lower trendline, bullish momentum is expected to continue with a potential target near $170-180.
💡 Short-term pullbacks inside the channel may offer entries as bulls eye higher resistance zones.

SOL breakout?Trading SOL on LTF was a good scalp; coming to the HTF, now this is looking good
Price action is still at exponential resistance, though. Fingercrossed, the bulls hold strong
Using STIC, i'm still bullish till otherwise.
#Tradesmartly

SOL Daily – Bullish Break of Structure with Trendline ReversalSolana is currently trading around $146, having broken out of the descending trendline and confirmed a bullish break of structure (BoS) to the upside. This signals a shift in market direction, now favoring long setups.
The price is above the Ichimoku cloud, with Span A at $140.00 and Span B at $126.13, confirming the bullish trend is supported not just by price action but also by momentum structure. The cloud is angled upward, reinforcing that bullish continuation remains the most likely scenario.
The optimal entry zone lies between $126.36 and $112.45, a key support area that previously acted as resistance and has since been validated by multiple reactions. A retracement into this zone would offer a high probability long setup, particularly if combined with a short-term TSI reset or bullish candlestick signal.
The Trend Strength Index (TSI) supports this scenario:
TSI(20): 0.89 — strong bullish momentum
TSI(10): 0.19 — early in the cycle, with potential for expansion
The main bullish target is $256.00, which aligns with the next macro resistance zone and offers a risk-to-reward ratio 1:4.
Trade Setup Summary:
Entry Zone: $126.36 – $112.45
Target: $256.00
Stop Loss: Below $95
Solana remains one of the top-performing Layer 1 blockchains in terms of throughput, user activity, and developer interest. Its low fees and high speed have supported growing ecosystems in DeFi, NFTs, and consumer apps. Despite past setbacks, recent improvements in network stability and increased institutional attention have reignited bullish sentiment. With the market shifting into broader altcoin rotation, Solana is well-positioned to benefit from renewed investor flows.
Disclaimer: This content is for educational and informational purposes only. It does not represent financial advice or a recommendation to buy or sell any financial instrument. Trading involves risk, and you should only trade with money you can afford to lose.

SOLANA (SOL/USDT) – Bullish Flag Forming on 4H!Hey traders!
#SOLANA is currently consolidating sideways and printing a bullish flag pattern on the 4-hour timeframe – a classic continuation signal after a strong upward move! 🚀
Here's the plan:
Wait for a clean breakout above the flag's resistance
Enter on the retest of the breakout level to confirm support
Apply strict risk management and target the next major resistance zone
Watch for increasing volume to validate the move
Why this matters?
The bullish flag often leads to explosive moves when confirmed properly. Don’t chase the breakout — let price come to you. Patience = profits. 🧘♂️
Key Levels & Entry Plan marked on chart
Drop your thoughts below – do you agree with this setup or see it differently?
Like & Follow for more clean, no-hype trade ideas!
#Solana #SOL #CryptoTrading #BullishFlag #TradingView #TechnicalAnalysis #Altcoins #CryptoSetup #BreakoutTrade

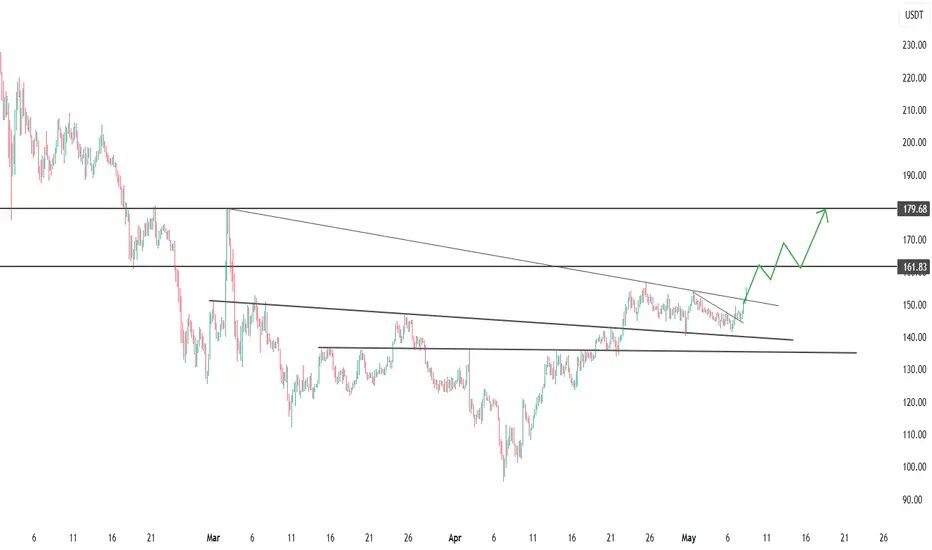
SOL broke through the resistance line near $150CRYPTOCAP:SOL - wedge broken, bulls take control
Price broke out of the descending wedge (140-150 → 150-162) and closed above 150 USDT on higher volume - a break of the medium-term trend.
📌 Levels
- S1 150 ± 3 - retest zone, S2 140 - April base.
- R1 161.8 - March resistance, R2 179-180 - wedge height and supply zone target.
📈 Scenario
A consolidation > 161.8 activates a move to 180; if successful, a push to 195 is possible.
⚠️ Risks
Failure < 147 will bring price back inside the wedge with a chance of 140.
As long as 147-150 holds, priority long.
SOLUSDT may rise to 200.0 after long-squeezeMarket maker collected liquidity from 168.5 (liquidation of buyers, entry of sellers and subsequent liquidation of sellers)
After a false breakdown the price went up on a light wave
After the long squeeze, the price is already going to continue the trend with peace of mind.
Ahead is a strong resistance from D1 180 - 180.3.
A break of the level will attract buyers. The target may be 200 - 205
Scenario: a retest of the resistance may end in a small correction. If there is no reversal and the price continues to test 180-180.3, we can expect a breakout, which may attract buyers and further growth to 200 - 205.


#SOL Don't worry until 240 $.but after that, 60 $ is coming.#SOL Don't worry until 240 $.but after that, 60 $ is coming.
#SOL Crash. We already warned when SOL is Trading above 240 $ ..
Past Analysis also attached.

5.5 RR tradeAssuming that one more impulse to the upside occurs from this corrective phase, this would be an excellent entry with great risk:reward and reasonable target!

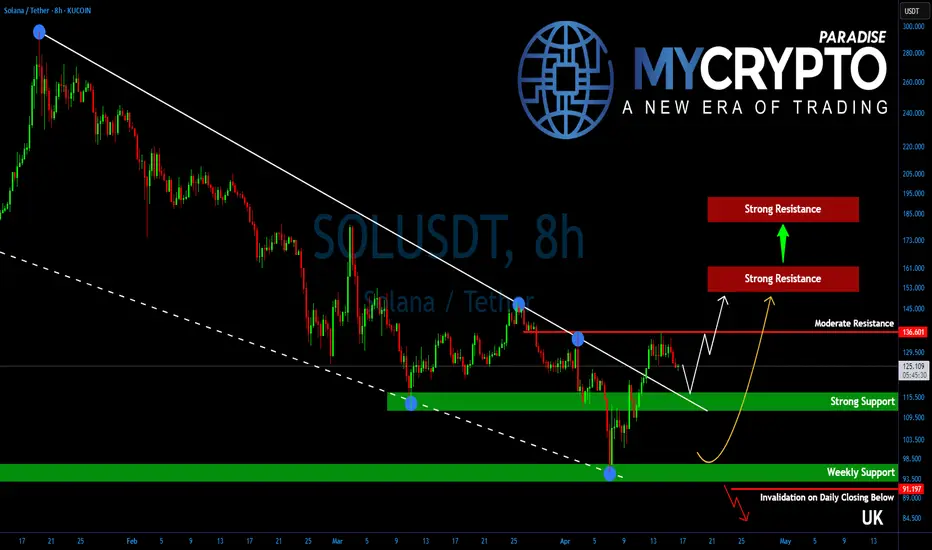
Solana Is One Breakout Away From a Bullish Explosion!Yello, Paradisers! Did you notice how #SOLUSD has been quietly positioning itself while the rest of the market remains uncertain? If you're not paying attention right now, you could be missing one of the cleanest setups on the charts.
💎After several weeks of downside grind and tight consolidation, Solana has just broken out of a falling wedge—a powerful bullish pattern that typically signals trend reversals or the start of a strong upside leg. This breakout wasn’t random either. It occurred after SOL successfully defended a key higher time frame support zone, signaling strength behind the move.
💎For #SOLUSDT, all eyes are on the $136.50 resistance level. This is a critical structural pivot. A clean break and close above this level would confirm a shift in higher time frame momentum from neutral to bullish. Until that happens, bulls still need to proceed with caution—but the setup is clearly developing in their favor.
💎Adding conviction to the idea of a bullish breakout are several supporting factors. Oscillators are showing bullish divergences, a classic sign that seller momentum is fading. At the same time, a golden cross formation on the 12-hour chart is getting closer which typically precedes sustained trend reversals and stronger moves to the upside.
💎If bulls succeed in reclaiming $136.50, the next price targets are $155–$160 as the initial strong resistance zone where some profit-taking could occur. If bulls hold strength, SOL is likely to head further higher and aim for $180–$190, which lines up with the target of the wedge pattern. This is a strong resistance zone and a level which could mark end of the corrective phase for Solana.
💎On the downside, immediate support lies between $110–$115. This is a well-defined range of demand and should offer strong buying interest if any short-term pullbacks occur.
Paradisers, strive for consistency, not quick profits. Treat the market as a businessman, not as a gambler.
MyCryptoParadise
iFeel the success🌴
SOL lower high/pullbackSOL nice LTF range, broke range -> range high reclaim now in next grey box -> potential sweep of highs -> reject red box into lower high or decent pullback before ATHs

SOL Inverted Head and Shoulders – Breakout Potential!🚀 SOL Inverted Head and Shoulders – Breakout Potential! 📈
SOL has formed an inverted head and shoulders pattern and is now testing the red resistance zone. If the price breaks through this resistance, the first target could be the green line level! 📊
Let’s watch this breakout unfold! 💼💸

SOLANAThis is just to show you how I look for my entries in my trading strategy. Please do not copytrade or market enter in solana after seeing this. This is purely an educational post for you to see so if you want, take notes and later apply and win!
Thanks for reading : )


Don't get carried away by the high price numbers in Solana... Solana broke the main zone on the two-hour chart and the target of $136 will definitely be touched... This analysis is consistent with the analyses of the 4-hour and daily charts, and all are in the direction of bearish targets...
Note: Equilibrium analyses may be delayed due to news or unpredictable events, but they will definitely arrive and are considered the best type of analysis for spot purchases...

#SOL/USDT#SOL
The price is moving within a descending channel on the 1-hour frame, adhering well to it, and is on its way to breaking it strongly upwards and retesting it.
We are seeing a bounce from the lower boundary of the descending channel, this support is at 144.
We have a downtrend on the RSI indicator that is about to break and retest, which supports the upward trend.
We are looking for stability above the 100 moving average.
Entry price: 149
First target: 153
Second target: 156
Third target: 161

long entry on SOLEntry at $142.52, tight stop at $138.76, take profit 50% at 157.13, take profit 100% at $178.95
