SOLANA NEEDS SOME CORRECTION !#SOL is in an up trend there is a same pattern in solana as gold in years ago i think the leadership of memecoins is in solana and bnb hands !
but for now IT NEEDS A BREAK !
there is an obvious bearish pattern in lower time frame that tells us a correction is indeed
check these out
SOLUSDT.3S trade ideas

Solana (SOL): Plan A/B/C, Where Are We Going?Solana had made a smaller 10% drop, forming a perfect liquidity grab, where the price now reached the upper resistance zone (from where we got rejected). Now we are left with 3 different plans here so let's wait for the perfect opportunity!!
More in-depth info is in the video—enjoy!
Swallow Team

SPOT SOL LONG 8.01.2025Pinning after containment of sales.
🎯Purpose:
218.29
I'll let you know when I record it manually.
‼️Risk per trade: 1% of the allocated funds for spot trading.
Thank you!

SOLANA 2H Update The $203 range for Solana is a significant level, and I expect that after breaking through this area, we will witness substantial growth.

SOL Solana bouncing off very strong support confluenceSOL Solana bouncing off very strong support cofluence. POC, Daily, Weekly and an Adam & Eve double bottom pattern. All great signs for a bounce here.

SOL (Solana) is about to crash BIG TIMEI call the shots anywhere everywhere all the time
CRYPTO:SOLUSD
See my Fib Levels for targets below.
Enjoy.

SOL/USDT 1H: Accumulation in Play – Rebound to $208?SOL/USDT 1H:Analysis
🚀 Follow me on TradingView if you respect our charts! 📈 Daily updates!
Current Market Analysis:
Price at $197.49, rejecting at the $204 FVG (Fair Value Gap).
RSI indicating potential hidden bullish divergence, suggesting underlying strength.
Market structure forming lower highs, with key resistance at the $204-$208 zone.
Trade Setup:
Confidence Level: 7/10 – Favorable setup but requires confirmation.
Entry: Wait for a retest of $196 support before entering.
Targets:
T1: $204 (FVG fill).
T2: $208 (Premium zone).
Stop Loss: Below $192 (recent swing low).
Risk Score:
7/10 – Decent R:R setup, but potential liquidity grabs below $192 pose risk.
Smart Money Analysis:
Accumulation likely occurring within the $192-$196 range.
Market Makers building liquidity below $192, possibly targeting a stop hunt before reversal.
Recommendation:
Wait for confirmation of support at $196 before entering long positions.
Increased volume is necessary to confirm a bullish move.
Be patient and watch for a liquidity sweep below $192 for a potential reversal entry.
Confidence Level:
7/10 – Bullish bias in play, but confirmation needed for execution.
🚀 Follow me on TradingView if you respect our charts! 📈 Daily updates!

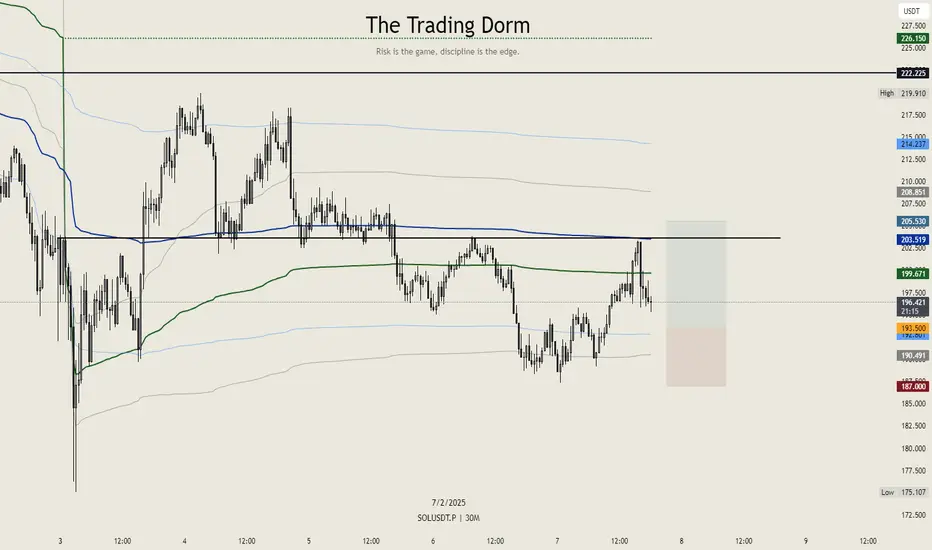
Solana $SOL Setup – Keeping it CleanSolana looks strong, so it’s time for a trade. The entry is placed at $193.50, with a stop-loss at $187 to keep risk in check. The target is set at $205.53, aligning perfectly with the monthly and weekly VWAP VALs.
This setup offers a 1:1.85 risk-to-reward ratio—nothing crazy, just a clean, structured trade. No moonboy fantasy for now, just following the price action and executing accordingly.
SOL - if price reach 300+ area - time to get OUTSOL - if the price reach 300+ area - it time to get OUT
price is in a long up trend
big volume
good news
often that's how trend ends

Solana (SOL): 14% Dump, Might Drop More!!!Solana has dropped 14% since last time we looked at it, filling our target zone.
As of now, we are seeing that sellers are still showing pressure and are trying to break the current zone, which then will result in further movement to lower zones.
We are waiting to see a proper breakdown here and then a movement towards the $161.
Swallow Team

SOLUSD - Weekly forecast, Technical Analysis & Trading IdeasMidterm forecast:
155.100 is a major support, while this level is not broken, the Midterm wave will be uptrend.
Technical analysis:
A peak is formed in daily chart at 295.850 on 01/19/2025, so more losses to support(s) 186.409, 175.250 and minimum to Major Support (155.100) is expected.
Take Profits:
218.928
243.197
264.400
294.450
350.000
__________________________________________
❤️ If you find this helpful and want more FREE forecasts in TradingView,
. . . . . Please show your support back,
. . . . . . . . Hit the 👍 BOOST button,
. . . . . . . . . . . Drop some feedback below in the comment!
🙏 Your Support is appreciated!
Let us know how you see this opportunity and forecast.
Have a successful week,
ForecastCity Support Team

SOL 4H RANGESOLANA is down -40% from making a new ATH to the bottom of the crash wick @ $175. Looking at the chart, unless BTC decides to gap down again from a TA standpoint SOL looks good here.
A triple tap of the bottom with a reclaim of the bullish orderblock that coincides with the golden pocket zone from local LTF high to low, followed by a strong reaction from that zone. Q1 is historically good for altcoins and so the all of these points added together the R:R at this level is good IMO.
Profit taking through the range quarters.
The idea is invalid once price accepts below the triple tap bottom under $170.

SOL/USDT Bullish Breakout Loading ? Key Levels & Confluence SOL/USDT Technical Analysis
Price Action & Key Levels
Price is consolidating inside a descending channel, typically a bullish pattern if broken to the upside.
Key breakout level
$195–$196 aligned with Fib 0.382 and trendline resistance.
Critical support: $186 lower channel boundary.
First bullish confirmation
A close above $198 (1H 50 EMA + Fib 0.5).
Target levels
First target: $202–$203 (Fib 0.618).
Second target: $210+ (previous high).
Stop-loss placement : Below $186 to avoid fakeouts.
RSI Analysis
If RSI is currently below 50, it suggests weak momentum, meaning price could still consolidate before a breakout.
If RSI crosses above 55–60, it confirms bullish momentum supporting a breakout.
A hidden bullish divergence (higher low in RSI while price makes a lower low) would strengthen the case for upside movement.
Volume Analysis
Breakout needs strong volume confirmation. If price moves above $195 with low volume, it could be a fakeout.
If volume spikes on a breakout, it signals institutional participation, increasing the likelihood of a sustained move.
Decreasing volume inside the channel is a good sign this indicates sellers are getting exhausted before an upward breakout.

idea for the long termBINANCE:SOLUSDT
I like it and I have plans for it in the next bear market .
I do not see that there is anything that prevents it from achieving the goal in the long run, it has all the ingredients and its project is very strong and will compete with Ethereum strongly .
I think in the next bear market it will be a historic opportunity to get it.

Solana Coin Do Not Miss This Long for 50% potential Gains In this video I have outlined a plan to buy Solana coin Using a suite of Fibonacci tools I have all the levels you need marked out . Follow for future videos and ensure to BOOST my Idea . Thankyou

Solana May Bounce from 176Solana May Bounce from 176
Based on past analysis, Solana has bounced twice from the blue zone near 176, which corresponds to a very strong support zone on the daily chart.
Historically, this same zone acted as a strong resistance.
Given this support level's significance, it is likely that the price may rise again from this zone, as illustrated in the chart.
You may find more details in the chart!
Thank you and Good Luck!
❤️PS: Please support with a like or comment if you find this analysis useful for your trading day❤️


Waiting for Sol to turn my trade on.I expect Sol to deep one more time below 190, but not much lower... then my long will be unleashed.

SOLANA WORST SCENARIO !#SOL made a clear divergence in its last highs now the pattern is clear its bearish !
we have a bearish pattern in BTC too so i think these two will fall together
there are 2 demand zones which can stop the market from falling down first one is around 110 $ and the other one is around 59 $ i think the first one can stop the market from falling more !
check out my last analysis on this coin

Solana is formed Bullish Trend and ended BearishnessIf SOLANA breaks descending trendline It heads new ATH( All Time High).
Solana will PUMP so Hard.

SOL ANALYSIS🚀#SOL Analysis :
🔮As we can see in the chart of #SOL that there is a crucial support and resistance zone around $190. The price took resist and break the zone. Now trading at the same zone. We could expect a bullish move from this level
⚡️What to do ?
👀Keep an eye on #SOL price action. We can trade according to the chart and make some profits⚡️⚡️
#SOL #Cryptocurrency #TechnicalAnalysis #DYOR

NEW BULL RUN FOR SOLUSDTWell based on the inflation rate of sol i am quite comfortable in predicting the price to go to 350-500$ this year 2025.
Five technical factors:
1. A strong support on the daily and 4hr timeframe with a visible uptrend
2. The instant bullish force stabilizing the severe bearish drop within a day.
3.Strong fib reflecting the current price bouncing from 176-200 to 370-489 till the end of 2025
Thankyou

SOLUSDT Binance DGeneral 2025
SOL mcap: $97B, sol px = $201
Visa mcap: $674B (6.9x, SOL px = $1,386)
Mastercard mcap: $519B (5.3x, sol px = $1,075)
AMEX mcap: $222B (2.23x, sol px = $460)
Tailwinds
- SOL ETF
- Firedancer goes live on mainnet
- largest number of dev in crypto (?)
- largest gainer in 2024
- AI agents moving onto SOL(?)
Headwinds
- largest gainer in 2024, can it continue(?)
- memecoin mania cool down(?)
- $trump launch, to sell and buy ETH <<< biggest concern.
========================
PA
- awkward looking double top, without a clear neckline.
- bounced off support & 0.382 today
- 11 & 22 MAs looking to cross 50sma
OBV
- scares me a bit, as its been on a downward trend.
- needs to reclaim support!!
