long entry on SOLEntry at $142.52, tight stop at $138.76, take profit 50% at 157.13, take profit 100% at $178.95
SOLUSDT.3S trade ideas

SOL looking good📊 SOL — Strong Support & Whale Activity Signal Potential Long Opportunity
🔎 Market Trend Overview
SOL, BTC, and ETH are all neutral, consolidating near their 21-day EMA after recent volatility.
Token Trend Current Price 21-day EMA Relationship
SOL Neutral $144.83 ~$143.50 Price near EMA
BTC Neutral $94,091 ~$93,500 Price near EMA
ETH Neutral $1,807 ~$1,800 Price near EMA
🐳 Notable SOL Whale Positions
Several large players have positioned both long and short — but the biggest exposure is clustered near current price levels:
Whale Position Size Entry PnL Notes
0x4a20 LONG (20x) $38.8M $144.90 +$9k Aggressive long
0xECB6 SHORT $6.6M $145.24 +$15k Part of portfolio
dydx1eq… LONG $5.8M $136.12 +$1.5k Moderate size
dydx1fn… SHORT $3.5M $250.82 +$475k Deep in profit
0x2c2f SHORT $1.9M $186.28 +$738k Very profitable
📍 Key SOL Liquidity Levels
Watch for these levels — heavy liquidation leverage suggests strong defense/support.
Level Liquidation USD Significance
$148.80 $45.7M Major resistance
$149.00 $45.6M Resistance cluster
$142.20 $43.8M Support level
$141.60 $41.5M Strong support
$141.40 $38.6M Support cluster
🚀 Trade Idea — Long SOL at Support
Entry: $141.50–$142.00
Stop: $138.50
Target: $148.50
R/R Ratio: 1:2.33
Safety Score: 8/10
Bias: Short-term bullish (3–5 days)
Rationale: Entering near a key support cluster where whales are positioned and liquidation leverage is high — signaling likely defense and bounce potential.

Solana (SOL): Re-Testing Major Moving Average Line | 200 EMASolana has reached the 200EMA line on the daily timeframe, which has been broken recently after a long rally to upper zones. We caught 2 possible trades here, where one would be 1:5 RR and the second one would be 1:3 RR.
More in-depth info is in the video—enjoy!
Swallow Academy

SOL 2025.05.01***Follow SEOVEREIGN to receive alerts.
**Boosts motivate SEOVEREIGN to analyze more assets.
**Our team regularly publishes analysis reports on the cryptocurrency market.
Short-Term Bearish Scenario for Solana
Currently, Solana appears to be forming a 1.13 Bat Pattern, a technical setup that suggests a potential short-term decline.
This could present an opportunity for those trading futures to consider a short position strategy.
Target 1: 149
Target 2: 145
Be sure to manage your risk properly and set a stop-loss level before entering a trade.
Continue monitoring the pattern's validity throughout the setup.

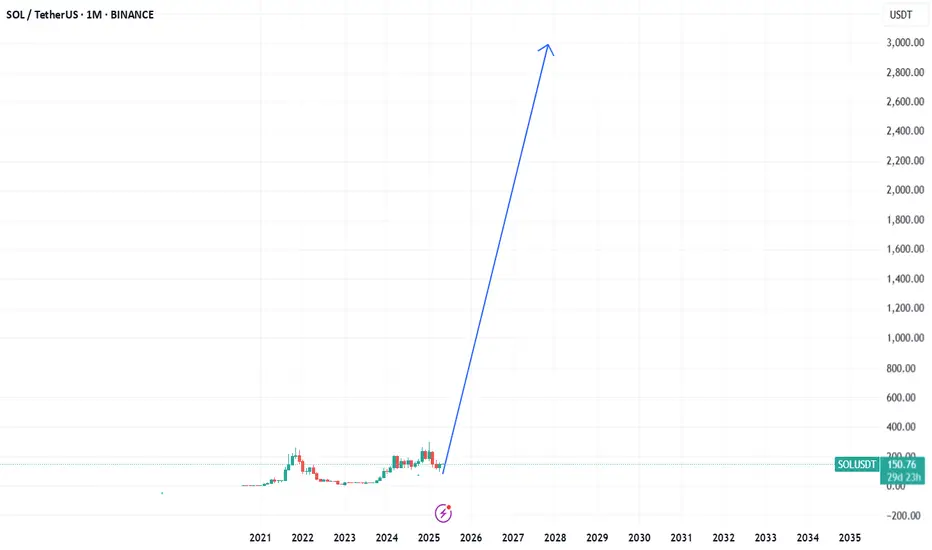
Solana similar to Tesla before it blow up, most used crypto 85% of the blockchain usage is in Solana,
Currently setting very low realtively to BTC,
Solana is the new Ethereum
3400$ should be coming !
SOLOn CRYPTOCAP:SOL you can see the support zone I mark out. Take them as POI and watch PA closely when it reaches them. When I see a proper confirmation on either of the support levels you see on the chart I will announce it asap and notify you guys about my entry.
Remember to always use a stop loss and proper take profit to eliminate emotions and secure the profits.
Goodluck!
I always appreciate a follow, it keeps me going :) thanks!!!

SOLUSDT - Quadruple Bottom SupportVery solid support line in green horizontal
This has been tested at least 4 or more times on this daily timeframe
Very bullish for Solana

Solana vs Ethereum – A Meme War or Market Shift?🔥⚔️ Solana vs Ethereum – A Meme War or Market Shift? 🧠📉
It’s getting spicy out here in the crypto arena... and the memes are hitting just as hard as the market caps! 💥
Over the weekend, Solana briefly flipped Ethereum in total staking value — triggering a fiery debate on whether that’s bullish or bearish for SOL. Some celebrated the milestone 🥂, while others, especially from the ETH camp, argued it reveals a deeper problem: Solana’s staking isn't really staking (as slashing isn’t automatic, and network restarts are still a thing). 🛑🔧
📸 Bonus Meme: Apparently Ethereum’s new logo is now Internet Explorer 😂 — can’t say the UX didn’t earn it.
🧠 The FXProfessor’s Technical Take: Let’s cut through the noise.
📉 SOLETH (Solana vs Ethereum Ratio)
Rejected at grand resistance: 0.088
Projected drop: -28% to 0.063
Structure: Bearish inside an ascending channel (highlighted in orange)
📊 ETHUSD
Support: $1,530
Rebound potential: $1,650 and beyond
Long-term structure still forming — this could be a spring.
📈 SOLUSD
Key support: $114
If that breaks higher, next test is $179, then $215
But failure at this level opens room for downside re-test near $80
💬 So where do we stand? On chart structure alone, Solana might still outperform ETH short-term — but technically, SOLETH suggests a correction is due.
🧑🏫 Yes, I’m emotionally attached to Ethereum — I have build on it, invested in it, got smashed on it for months..pain, at least for now. But I trade what I see (or at least i try damn it!)
Let the memes roll, but let the charts speak. Drop your thoughts — SOL or ETH? 👇
One Love,
The FXPROFESSOR 💙

Going long on SolanaBINANCE:SOLUSDT
Solana has experienced climatic volume to the downside, bullish RSI divergence, and now it seems ready for a big bounce. Also, there is a Hammer candlestick at the bottom of the decline.
Good luck to you

BEARISH SENTIMENT ON SOLUSDTConfluences for the trade are:
1) Market Structure(BoS), 2) Liquidity, 3) QM-Orderblock(POI).
To target a 1:2.5RR minimum.
Note: the market is all about probabilities which also makes my analysis a probability.

SOL/USDT – 3D Long Signal Active📅 April 29, 2025
The system triggered a long entry at the last 3D bar close.
Currently, the price remains around the same levels.
✅ System conditions for a long are fully met:
MLR > SMA > BB Center > PSAR
Price is trading above the 200 MA on the 3D timeframe.
⚠️ Caution:
On the 1D timeframe, price is still below the 200 MA, which suggests some lingering weakness. Proceed carefully.
📍 Strategy Plan:
Consider entering long at today’s daily close or at the next 3D bar close.
Suggested stop-loss: below the latest PSAR dot for system integrity.
🔔 Keep an eye on updates and thank you for reading! 📈📊

Short SolanaSOL broke through the ascending trendline and the support level. The decline to a support level at $123.9 is expected to happen

sol buy midterm"🌟 Welcome to Golden Candle! 🌟
We're a team of 📈 passionate traders 📉 who love sharing our 🔍 technical analysis insights 🔎 with the TradingView community. 🌎
Our goal is to provide 💡 valuable perspectives 💡 on market trends and patterns, but 🚫 please note that our analyses are not intended as buy or sell recommendations. 🚫
Instead, they reflect our own 💭 personal attitudes and thoughts. 💭
Follow along and 📚 learn 📚 from our analyses! 📊💡"

SOLUSDT SHORT IDEAUnder current market conditions, the area near 148.3 has been identified as a critical resistance zone, where the AI model detects a high-probability trade setup.
From a technical perspective, a clear directional bias based on recent price action patterns. Suppose the market demonstrates increased volume and price stability above key moving averages in the 148.3 area. In that case, traders are advised to monitor for trend-continuation entry opportunities in alignment with the prevailing momentum.
Profit targets are defined at 145.0 and 140.2, corresponding to logical technical support zones. These levels are designed for staged profit-taking across different trade management styles. Stop-loss should be strictly enforced at the designated level; once breached, the strategy is considered invalidated in order to limit potential downside.

SOLUSDT may rise to 200.0 after long-squeezeMarket maker collected liquidity from 168.5 (liquidation of buyers, entry of sellers and subsequent liquidation of sellers)
After a false breakdown the price went up on a light wave
After the long squeeze, the price is already going to continue the trend with peace of mind.
Ahead is a strong resistance from D1 180 - 180.3.
A break of the level will attract buyers. The target may be 200 - 205
Scenario: a retest of the resistance may end in a small correction. If there is no reversal and the price continues to test 180-180.3, we can expect a breakout, which may attract buyers and further growth to 200 - 205.

Is Solana's Price Action Already Priced In?We are the SeoVereign Trading Team.
With sharp insight and precise analysis, we regularly share trading ideas on Bitcoin and other major assets—always guided by structure, sentiment, and momentum.
🔔 Follow us to never miss a market update.
🌟 Solana: One of the Highest Potential Assets in the Market Right Now
Riding the wave of Bitcoin’s bull market, Solana is showing remarkable potential, moving in sync with the broader market trend.
🎯 Price Targets:
1st Target: 179.5 — Breaking the initial resistance
2nd Target: 181.3 — Mid-term upward objective
3rd Target: 182.9 — Strong trend formation zone
We are positioning to buy Solana in bulk, capitalizing on its high potential during Bitcoin’s bull run.
However, whether Solana will continue its upward trajectory or if it has already been priced in and is due for a pullback is something only time will tell.
🚀 Is now the perfect moment to enter Solana, or should we wait? The market will reveal the answer.

Just a Thought: What If the Big Bull Run Starts Next February?Chart: SOLUSDT Perpetual (1W)
Let’s play devil’s advocate for a second…
📉 What if:
The most recent pullback from Solana’s all-time high wasn’t just a dip to find support, but a high timeframe market structure break (MSS)?
We wicked right into the Point of Control (POC) at $126, a critical level going back to Solana’s inception. Many saw that as a liquidity sweep, which it is, but what if that break was confirmation of a shift in the macro structure?
Since then, we’ve seen a corrective rally, and as of now, price is approaching the golden pocket (0.618–0.65) around the $200 region coupled with time Fib confluence around June 25.
⚪ The ABC Hypothesis:
There’s a clean potential for an (A)-(B)-(C) correction. If the market can’t push through the $200 resistance in June, we could see a dragged out move down into the 1:1 extension, which interestingly aligns with key monthly naked POCs (MNPOCs) at $73 and $41, and specifically the 1:1 at $49 (highlighted on the chart for September 25).
That would create a textbook ABC correction, where:
• A = drop from ATH to MSS
• B = golden pocket retracement
• C = 1:1 extension, sweeping long-term liquidity
📅 What if the real bull run doesn’t start until Feb 2026?
Everyone’s calling for the big breakout this year… but what if we need one last washout to fully reset? That timing aligns eerily well with early Q1 2026, after a final leg down.
Chart Legend:
• ✅ Green line = current price
• 🔴 POC = Point of Control (macro volume node)
• ⚪ White lines = ABC structure
• 🔵 Blue verticals = time-based Fibonacci
• 🟡 Golden Pocket = 0.618–0.65 retracement
• 🟣 MNPOC Levels = untested monthly points of control
Just a theory. Not advice. DYOR.
What do you think? Could the real reset be coming?

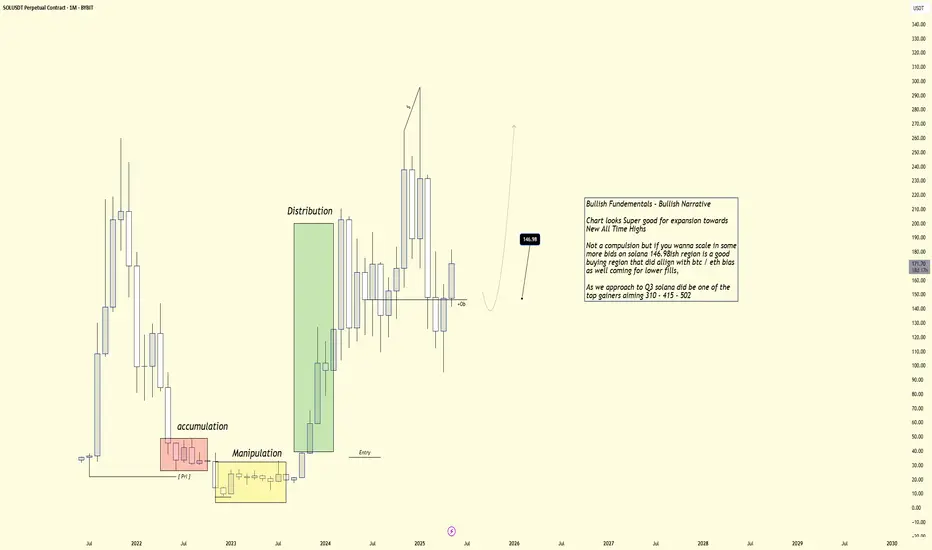
SOLUSDT | ANALYSIS
BRAEKDOWN
Bullish Fundementals - Bullish Narrative
Chart looks Super good for expansion towards New All Time Highs,
Not a compulsion but if you wanna scale in some
more bids on solana 146.98ish region is a good
buying region that did allign with btc / eth bias
as well coming for lower fills,
DCA ENTRY
146.98
TRIM REGION
As we approach to Q3 solana did be one of the
top gainers aiming 310 - 415 - 502
Long trade
🟩 Buyside Trade Log
📈 Pair: SOL/USDT
🏷️ Type: Intraday | LND → NY Session PM
🧠 Setup: Breakout
🆔 Trade ID: #SOL-0511B
📅 Date: Sunday, 11th May 2025
🕐 Time: 1:00 PM
🔹 Entry Price: 172.541
🔹 Profit Target: 178.912 (+5.02%)
🔹 Stop Loss: 172.316 (-0.31%)
🔹 Risk-Reward Ratio: 16.24
The buyside breakout was confirmed during the LND to NY session transition. Price action displayed sustained momentum through prior resistance, accompanied by strong volatility during the session overlap. Market structure and order flow favoured continuation, with a clear liquidity void overhead. The entry signal was triggered as price reached the previous and pivotal zone — the Sellside/Buyside In Balance (SIBI) area — further validating directional intent.

SOLANA - Tale of Two ExtremesOver the past ten months, Solana’s price action has swung from manic highs down to panic lows—and now into a disciplined base:
Euphoric Rally (Oct ’24 – Dec ’24)
SOL surged from ~$100 to a December peak near $290 on booming DeFi activity, NFT hype, and new network tooling.
The green‐shaded bars in late November/early December mark a near-vertical ramp, with “B” buy signals clustering as momentum supercharged itself.
Brutal Unwind (Jan ’25 – Mar ’25)
Once Bitcoin stalled and macro headwinds arrived, SOL gave back almost two-thirds of its value, plunging from $270 to a $96 trough by mid-March.
Red “S” sell markers at lower highs confirmed aggressive profit-taking and capitulation.
Disciplined Base Building (Mar ’25 – May ’25)
A clear single bottom at the P0 pivot around $96 (also last year’s low) drew in fresh bids each time price tested that floor.
Since early April, SOL has chopped sideways between $100–$140, tightening volatility and coiling like a spring.
2. Technical Anatomy of the Bounce
As of today, SOL sits at $175.43, flirting with short-term resistance and carving out a fresh up-move:
Level Price Role
Current (Monday’s High) $175.43 First line for breakout conviction
Year-Open Pivot (Y0) $189.50 Next hurdle—flip to support if cleared
Year-High (YH) $295.00 Measured target of the Dec rally
Dynamic Fib R1 $160.56 Prior falling-wedge resistance, now support
Dynamic Fib R3 $137.76 Secondary support on pullbacks
Volume & Momentum: Recent green candles have arrived on increasing volume, and fractal buy signals (“B” dots) cluster on each higher low—classic signs of renewed demand.
Pattern Resolution: What looked like a falling wedge from January has broken up through its upper trendline, validating the bullish bias.
3. Catalysts & Sentiment Drivers
Macro Tailwinds: Any dovish shift in Fed policy or a sustained Bitcoin rally above $70K will likely turbocharge altcoins like SOL.
On-Chain Upgrades: Watch for network announcements (e.g., new staking features, throughput improvements) that can reignite developer interest.
Event Flow:
FTX Claim Distributions: Final phases due in late May could return tokens into the ecosystem and fuel liquidity.
DeFi Incentive Programs: Fresh liquidity mining launches often spark sharp altcoin reprieves.
4. Strategic Playbook
Aggressive Entry:
Trigger: A daily close above $175.43 (Monday’s high) locks in the breakout.
Targets:
$189.50 (Y0 pivot)
$230–$250 (interim swing highs)
$295 (YH, the December peak)
Risk-Managed Longs:
Pullback Setup: A retrace to $160.56 (Dynamic Fib R1) offers a lower-risk entry with tight stops below $155.
Stop Loss: Under $137.76 (Dynamic Fib R3) keeps you clear of a retest of the March low.
Option Flavor:
Call Spreads: Consider a $180/$200 call spread into June expiries—defined risk with asymmetric upside if SOL breaks higher.
Caution:
A failure to hold $160 on a daily close exposes SOL back to the coiled range ($140–$100), so trim or hedge if that level cracks.
5. Conclusion: Coiled for Altseason
Solana’s collapse from $290 to $96 cleaned out weak hands. The subsequent wedge-style base and recent breakout attempt speak to a market that’s ready for its next leg up—provided it can conquer $175.43 and flip $189.50. Keep an eye on on-chain news and macro flows: if they align, SOL could sprint toward $230 and beyond, rejoining the next chapter of crypto’s broader altseason.

Short trade
15min TF overview
🟥 Sellside Trade Log
📈 Pair: SOL/USDT
🏷️ Type: Intraday | Tokyo Session AM
🧠 Setup: Breakout
📅 Date: Sunday, 11th May 2025
🕝 Time: 2:30 AM
🔹 Entry Price: 174.933
🔹 Profit Target: 171.559
🔹 Stop Loss: 175.380
🔹 Risk-Reward Ratio: 7.55
Reasoning
Sellside trade taken after observing weak follow-through on previous bullish movement. Price action showed signs of exhaustion below a key resistance level, with a lower high forming on reduced volume. This indicated potential distribution. Entry was timed following a clean break of minor intraday support during the Tokyo AM session, aligning with short-term bearish structure and targeting nearby resting liquidity.

Long trade
15min TF
🟩 Buyside Trade Log
📈 Pair: SOL/USDT
🏷️ Type: Intraday | NY Session PM
🧠 Setup: Breakout
📅 Date: Saturday, 10th May 2025
🕔 Time: 5:00 PM
🔹 Entry Price: 172.541
🔹 Profit Target: 176.110 (+2.07%)
🔹 Stop Loss: 172.316 (-0.13%)
🔹 Risk-Reward Ratio: 15.86
Buyside trade undertaken after reinforced failed sellside delivery from the previous setup. This behaviour suggests strong underlying buyside pressure. Target liquidity is observed higher up, aligning with continuation expectations.

SOUL for a SOL - Part 1Hey Guys! This is M-Prof of SOL
The 4H SVP chart of SOL/USDT shows a clean bullish continuation with strong volume acceptance at higher levels. After consolidating around the $166–$170 range where the POC and VAL stacked tightly, Solana broke out impulsively, forming a fresh profile with value clearly migrating higher. The new POC and VAH are now centered near $174–$176, confirming that buyers are comfortably accepting higher prices. The thin tail below $171 shows rejection of lower prices, suggesting a strong demand zone now sits between $171 and $173. As long as SOL holds above this value area, any dip into that range offers a good risk-reward long opportunity. If the price accepts above $176.5, it could trigger further upside targeting $180+. Bias remains bullish above $171.
Coming to my doodle - Breaking the blue box would drag to the green one, changing structure though the latter towards the top is most probable!
