SOL/ETH Prediction - 2025 Altcoin CycleSolana has been outperforming Ethereum and several players in Altcoin category.
But it has also been a meme rug arena.
I believe $TRUMP and $MELANIA memecoins are marking a big top signal in Solana and the time for Ethereum is coming.
SOLUSDT.3S trade ideas

Solana May Rise Again After This Profit-Taking MomentSolana May Rise Again After This Profit-Taking Moment
After breaking out of the pattern on November 6, 2024, Solana surged by nearly 46% from the breakout zone. The top was reached at 264.50 on November 22, 2024, followed by a slow correction.
It appears that the entire crypto market experienced a profit-taking moment, anticipating Trump's inauguration as President on January 20, 2024.
The chances are that we may see another bullish wave after the price tests a strong support zone between 176.50 and 182.50.
We may see Solana rising again in the coming weeks, with targets at 210, 230, and 253-254.
You may find more details in the chart!
Thank you and Good Luck!
❤️PS: Please support with a like or comment if you find this analysis useful for your trading day❤️

Asset-Wise Chart Analysis and Key Levels
This is my idea for each asset based on the chart analysis. Please review and improve these ideas to suit your risk management and trading style.
1. Bitcoin (BTC/USDT)
Timeframe: 30-minute chart
Analysis:
Support Zone: Strong bounce observed around $102,000. Likely a major demand zone.
Resistance Zone: Testing resistance near $105,000-$106,000.
Indicators:
RSI: Showing recovery, but near overbought territory. Look for divergence for confirmation.
EMA: Price trending above short-term EMAs, signaling bullish momentum.
Outlook: Breakout above $106,000 could signal a strong bullish rally; failure may trigger a retest of $102,000.
2. Ethereum (ETH/USDT)
Timeframe: 30-minute chart
Analysis:
Price Action: Triangle formation with price tightening near $3,300.
Resistance Zone: $3,350 area with repeated rejections.
Support Zone: $3,100 has held multiple times.
Indicators:
BOS (Break of Structure): Bearish; the recent pullbacks suggest potential short setups.
Volume: Declining on lower levels, suggesting weak buyer pressure.
Outlook: Watch for a breakout above $3,350 or a breakdown below $3,100 for directional clarity.
3. Solana (SOL/USDT)
Timeframe: 30-minute chart
Analysis:
Trend: Descending triangle observed, with lower highs consistently.
Resistance Zone: $260-$270 area; repeated failure to breach.
Support Zone: $240; strong demand observed here.
Indicators:
RSI: Neutral, with no clear divergence.
MACD: Bearish crossover hints at potential downside pressure.
Outlook: Breakdown below $240 could signal a bearish continuation to $220. Bulls need a decisive close above $270.
4. Avalanche (AVAX/USDT)
Timeframe: 4-hour chart
Analysis:
Resistance Zone: $48-$50; multiple failed attempts to breach.
Support Zone: $36-$38, tested and held successfully.
Indicators:
CHoCH (Change of Character): Bullish signs appearing near support.
EMA: Price stuck between EMAs; watch for a breakout or breakdown confirmation.
Outlook: A bounce from $36 support could target $44. Otherwise, a drop below $36 might push toward $32.
5. 1000Blocks (1000BLOCKS/USDT)
Timeframe: 4-hour chart
Analysis:
Fakeout: Recent rejection of key levels, signaling weak bullish attempts.
Resistance Zone: $0.042 area, critical to watch.
Support Zone: $0.035 holding well for now.
Indicators:
RSI: Divergence indicates potential reversal.
Volume: Lower during the rally, signaling lack of conviction.
Outlook: A sustained breakout above $0.042 is needed for continuation; otherwise, risk of returning to $0.030 remains.
6. Polkadot (DOT/USDT)
Timeframe: 4-hour chart
Analysis:
Resistance Zone: $7.50-$8, previously rejected.
Support Zone: $5.75-$6; multiple bounces suggest strong demand here.
Indicators:
CHoCH: Repeated bullish reversals at support zones.
EMA: Price testing resistance at EMA levels.
Outlook: Consolidation likely. Bulls need to reclaim $7.50 for continuation, while bears target $5.75.
7. Axie Infinity (AXS/USDT)
Timeframe: 4-hour chart
Analysis:
Support Zone: $5.50; held firm on multiple occasions.
Resistance Zone: $6.50-$7; consistent rejections.
Indicators:
Volume: Declining as price approaches resistance.
MACD: Neutral, awaiting momentum clarity.
Outlook: Breakout above $7 could lead to a rally toward $8. Failure may bring price back to test $5.50 support.
8. Filecoin (FIL/USDT)
Timeframe: 4-hour chart
Analysis:
Support Zone: $5; currently showing accumulation signs.
Resistance Zone: $6.50-$7; price struggling to break higher.
Indicators:
CHoCH: Repeated bullish signals near support.
RSI: Near oversold, potential reversal.
Outlook: Likely to test $7 resistance again; breakdown below $5 could indicate further weakness.
This is my idea for each asset based on the chart analysis. Please review and improve these ideas to suit your risk management and trading style.

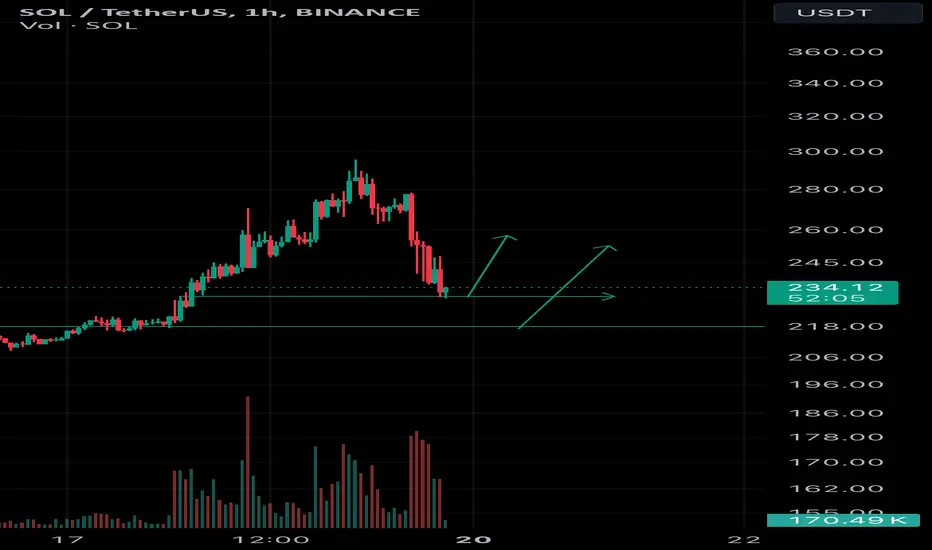
SOL/USDT 1H: Accumulation Signals a Breakout to $270!?SOL/USDT 1H Chart Analysis
Current Price: $239.33
Market Condition:
Consolidation phase with signs of accumulation.
Key Levels:
Entry Zone: $238-$240
Targets:
T1: $250 (key resistance)
T2: $260
T3: $270
Stop Loss: Below $232 (recent support).
Technical Highlights:
Hidden bullish divergence on RSI.
Volume profile indicates strong support at $235-$238.
Previous resistance at $250 now acting as a magnet for price.
Smart Money Analysis:
Accumulation evident at support.
Market makers likely positioning for the next leg up.
Recommendation:
Long position favorable with a confidence level of 7.5/10.
Maintain tight risk management and watch for breakout confirmation above $240.
Score: 7.5/10 - Clear risk/reward with strong technical and volume support for upside potential.

solusdt.p Greetings dear friends
Solana currency
Analysis in one hour time
Marked points to enter in the time of one minute and five minutes
good luck

Solusdt Lol back at support buying some here but dont be surprised if it goes all the way down to 220 as the crypto market is correcting .
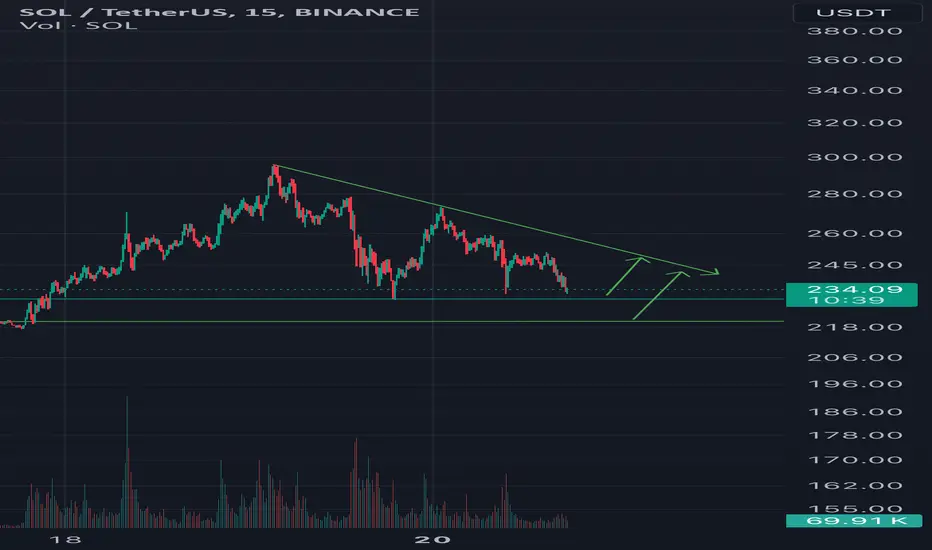
SOLThe analysis presents an Elliott Wave count for SOL/USDT on the 15-minute timeframe. Key observations include:
Primary Trend: A clear 5-wave upward structure is marked, with waves (i) to (v) completed.
Correction Phase: An ABC correction is identified, with wave C reaching within the Fibonacci retracement zone (0.618-0.786).
Wave Count: Within the correction, a smaller wave structure (w and ii) is outlined, with potential support near the Fibonacci levels.
Trendline: A descending trendline indicates resistance.
Potential: The current zone (blue rectangle) serves as a support or decision area for the next movement.
The analysis suggests a possible continuation of the uptrend if the support zone holds.

Is #SOL Ready For a Major Pullback or Not? Key Levels to WatchYello, Paradisers! Is #SOLUSDT gearing up for a breakout, or will we see a sharp bearish turn? Let’s analyze the critical levels and what lies ahead for #Solana:
💎#SOL is currently moving within a classic Descending Broadening Wedge—a pattern often associated with significant trend reversals. The price is approaching the descending resistance near $223.45, and a decisive breakout above this level could ignite a strong bullish rally.
💎If #SOLUSD manages to close above $223.45 on the 8H or daily chart, we could see an explosive move toward the next major resistance zone between $250 and $270. These levels could act as key profit-taking zones for bulls, so keep a close watch on trading volume and momentum.
💎On the flip side, #Solana has a strong demand zone around $155.89–$168.69, which has consistently attracted buyers. However, if we see a confirmed break and close below $155.89, the bullish structure would be invalidated, opening the door for a deeper correction toward $130–$140.
💎The recent liquidity sweep at the demand zone shows how the market is shaking out weak hands before a decisive move. Stay patient and wait for confirmation at these key levels before entering a trade.
Stay focused, patient, and disciplined, Paradisers🥂
MyCryptoParadise
iFeel the success🌴

mostly trade patterns#triangle pattern in solana I quite coomon pattern to see
its for my own research / analysis

btfd sol?TA on H12 SOL
- channel bullish break
- 200ma and rsi oversold signal supported bottom price
- PA approaching $220 level
- Bybit weekly resistance at $260
bullish imo

Solusdt Lol if this broken sacam doeant hold 230 then 220 will be next . Crazy how solana cant handle transactions without braking . Wonder if this is actually the catalyst to rotate the money out of this failed network. Also trump coin down to 44 from 74 thats also the reason why solana crashed 20% quickly .

SOL: A bigger move is coming!Keep an Eye on SOL
Now is the time to watch SOL. If the price breaks to the upside, we could see a significant move that might take it above $250.
Trading Setup
If you’re considering trading SOL, here’s a quick setup that may help you.
The idea is: Buy when the price breaks above $223 and take profits at the levels shown in the chart.
Targets:
1. $227
2. $237
3. $244
-------------------------------------------
About our trades:
Our success rate is notably high, with 10 out of 11 posted trade setups achieving at least their first target upon a breakout price breach (The most on TW!). Our TradingView page serves as a testament to this claim, and we invite you to verify it!

Sol for your soulWeekly chart looks bullish although I thought it could be a double top but the candle says otherwise.
Today the whole market is catching pace, still in parallel with BTC smoving strongly to our Intial target. At fib level 1.681, denying any large corrections/reversals.
Solana enjoying the increase in demand therfore could sea new ATH (All time high)
Please don't forget SL or you gonna be calling your buddy asking him will it come back up? Ha bro? Is it? Are you sure it's a long ? Help me! Please God I'll be good forever, I will always give to the poor this goes back
Good luck

Solanas waiting game.Sol has been printing a large cup and handle pattern in the 3D chart. A correction or wick to $100 still doesn’t invalidate the pattern. Patience is key in swing trading. In general SOL has been holding strong thus far.

Sol daily chart analysisSol daily chart analysis
everything is clear in this chart i think last 10 days of Jan will be high bullish
things will took time but we are near guys +

SOLANA, Where is the best zone to long? SOLUSDT / 1D
Hello Traders, welcome back to another market breakdown.
The market is showing strong bullish momentum, breaking through key resistance levels and signaling a potential continuation to the upside. However, The price is rejecting the Previous all-time high. Hence, instead of jumping in at current levels, I recommend waiting for a pullback into the breakout zone for a more strategic entry.
If the pullback holds and buying confirms, the next leg higher could target:
1- First Resistance: Immediate levels formed during prior consolidation.
2- New all-time high
3- The one standard deviation target is shown in the chart.
Stay disciplined, wait for the market to come to you, and trade with confidence!
Trade safely,
Trader Leo.

Solana Trend Lines are Interesting2D time frame and lots of angles, but find them interesting but I trade the horizontals.
Look for the First previous high on the time frame you are trading and very often the re-test will be down to that first previous high, one the 1hr that's $265-66 ish, traders are front running that spot
quite often this re-test buy area is between the .618 and the .786 or on the 61.8
strong trending moves may only retrace to the 38.2 on the way up, but most likely eventually will get retested

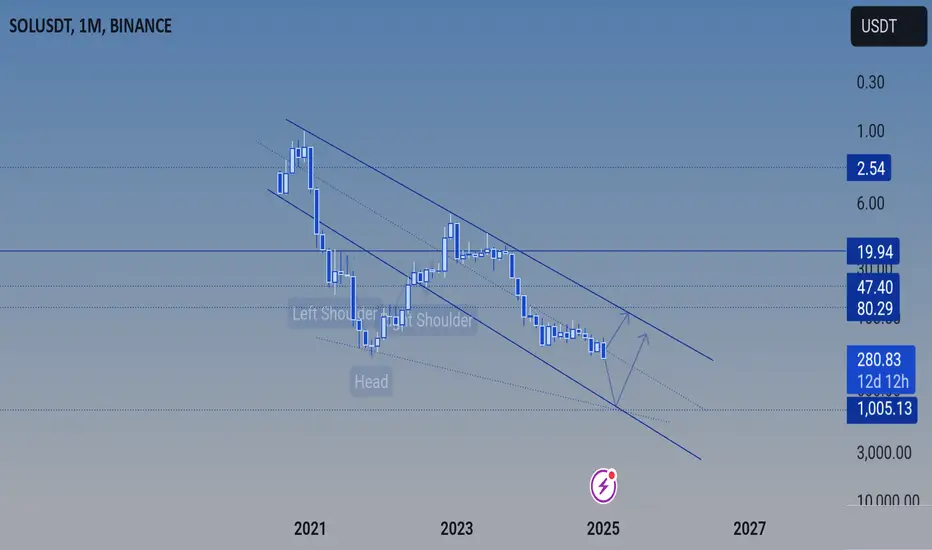
Can Solana really reach $1000 by the end of this year?Solana is moving in a strange regression trend that previously had a breakout. It formed an inverted H&S pattern, and the price returned to the trend. Based on this trend, Solana could potentially touch $1000, creating a significant double top.
Currently, since Solana could set a new ATH by breaking the resistance, if it stays above $300 and holds it we might see new highs, with the price moving towards $500 first. Note that since it looks like a double top, the price could fall at any time, and if the market becomes too bearish, Solana could have a bearish breakout from this trend, reaching $50 or even lower.
However, if Solana just had a fake breakout and fails to hold $250 and $200, we could see the price drop to $80 before the next bullish move.
The TrumpCoin Craze: What’s Really Going On?Yesterday, something truly bizarre happened in the world of crypto. Donald Trump—yes, that Donald Trump—launched his very own cryptocurrency, TrumpCoin ($TRUMP).
At first, like everyone else, I thought his account had been hacked.
I mean, launching a meme coin just days before his presidential inauguration? Come on...
But nope, it’s 100% real. Verified.
Like many others, I got curious and, let’s face it, greedy. So, I bought in. The result? I cashed out at a nice 3x profit, enough for a fun night out. But before we dive into the crazy market activity, let me clarify a couple of things:
- I’m not a Trump fan. This isn’t about politics.
- I don’t think this is a rug pull, at least not intentionally .
It seems more like someone who doesn’t fully understand how crypto works decided to jump in.
A Brief Timeline of Chaos
TrumpCoin was announced on his social platforms, including Truth Social and X (formerly Twitter). Initially, everyone thought it was fake news. I mean, a meme coin with his name on it? Right before inauguration day? It screams “scam.” But soon after, major crypto news outlets confirmed its legitimacy.
And then the madness began. Within hours:
- Market cap: Over $14 billion at the time of writing(and climbing).
- Trading volume: A jaw-dropping $11 billion in just one day.
- Price swings: The coin hit a high of $3.30 before dipping below $1.50 and now is above $4.
Trump’s company, CIC Digital LLC, reportedly holds 80% of the coin supply, making this a financial windfall for him—even if the project crashes.
The Crypto Community Splits
This move has divided the crypto space. On one hand, you have people who are treating $TRUMP like any other speculative asset. ( Hi, that’s me! )
On the other, there are folks who see it as a statement of loyalty to Trump. Then there’s a third group—the skeptics—who warn that this could end in disaster.
The real problem? Newbies are piling in without understanding what they’re doing. The hype is pulling in people who don’t know a rug pull from a blockchain. They’re buying and buying, hoping to ride the wave, and are likely to get burned when the bubble bursts.
Is This a Rug Pull?
Let’s address the elephant in the room. With 80% of the supply in Trump’s control, the setup raises eyebrows. But is this an intentional scam? Probably not. If anything, this feels more like a PR stunt gone wild—a way to cash in on his fame and make a splash before returning to the White House.
That said, the outcome could still be the same. At some point, the hype will die, the price will tank, and many will lose money. The bigger it gets, the harder it’ll fall.
My Take: Enjoy the Ride, but Be Careful
TrumpCoin is the epitome of crypto’s wild side: volatile, unpredictable, and more about hype than substance. If you’re diving in, know what you’re getting into. For me, it was a quick trade—buy low, sell high, and get out. But I worry about the inexperienced investors who are holding on, hoping for it to hit $10, $20, or even higher.
So, here’s my advice:
Don’t invest more than you can afford to lose.
Take profits while you can.
Remember, just because something is popular doesn’t mean it’s sustainable.
Whether $TRUMP reaches a $25 billion, $50 billion market cap or crashes spectacularly, one thing’s for sure—it’s going to be one heck of a ride.
Stay safe out there, and happy trading!

SOLANA: MAJOR BREAKOUT WITH HIGH CONVICTION LONG SETUP$SOL/USDT 6H Analysis
LONG SETUP 🟢
• Major breakout from descending trendline with 7.94% gains
• Volume confirming breakout (6.02M)
• FVG at $240-250 = potential pullback zone
Targets:
T1: $300 (psychological)
T2: $330
T3: $380
Invalidation: Break below $220
12H VIEW
4H VIEW - MAYBE RETEST FROM TRENDLINE HERE
Note: Wait for potential retest of breakout around $250 for better entry. Strong momentum suggests continuation. Manage risk accordingly.
#Solana #Crypto #TechnicalAnalysis


Solana (SOL/USDT) Weekly AnalysisSolana has demonstrated a strong bullish recovery, bouncing off the $220-$230 support zone, indicating significant buying interest in this region. Currently, SOL is trading around $270, and we are observing price consolidation with the potential for a breakout.
Key Levels to Watch:
Support Zone: $220 - $230
This area has acted as a strong demand zone, where buyers stepped in to defend the price.
Resistance Zone: $290 - $300
A breakout above this resistance zone will signal a continuation of the bullish trend.
Bullish Scenario:
If Solana successfully breaks and holds above the $300 resistance level, we could see a rally toward $350 and potentially higher levels. The bullish structure on the weekly timeframe suggests that buyers are regaining control.
Bearish Scenario:
Failure to break the $290 - $300 zone may lead to a pullback, with the $230 support zone acting as a critical level for buyers to step in again. A breakdown below $230 would invalidate the bullish outlook.
Technical Indicators:
Trend: Bullish on the weekly chart, with higher highs and higher lows.
Potential Targets: $300 (immediate resistance), $350 (next major target after breakout).
Stop Loss: If you're entering a trade, consider placing a stop loss below $230 to manage risk.
Conclusion:
Solana is at a decisive point, and traders should closely monitor the $290-$300 resistance zone for signs of a breakout. A bullish breakout could lead to significant upward momentum, while rejection might cause a short-term retracement.
