Elliott Wave | Bearish End Confirmed? | Last Chance Before the DBINANCE:SOLUSDT
The current structure suggests we are approaching a key decision point. Price has completed an a-b-b correction and is now reacting within the 61.8%-88.7% Fibonacci retracement zone, which could trigger a relief bounce before further decline.
📉 **Bearish Outlook:**
- The recent structure confirms a completed a-b-c move, leading to a potential Wave (B) retracement.
- The final bearish target lies in the "End of Bear" zone (~109 USD), where a final capitulation may occur.
- If we break far below **109 USD**, expect an accelerated sell-off.
📈 **Bullish Scenario?**
- The 78.6%-88.7% Fibonacci retracement zone could push SOL towards a short-term bounce before resuming the bearish trend.
- A valid long trade is possible if this support holds.
⚠️ Key Levels to Watch:
✅ Bullish Rejection Zone: 78.6% - 88.7% Fibo
❌ Break Below 105 USD = Full Bearish Confirmation
---
### 📌 **Trading Plan:**
1️⃣ Potential Short-Term Long if 78.6% - 88.7% Fibo holds.
2️⃣ Target: Resistance before wave (C) completes.
3️⃣ Short Confirmation** after rejection OR break below 105 USD.
‼️ Risk Management:
- If price fails to hold, a deeper correction is expected.
- Trade with proper stop-loss & confirmations!
💬 What do you think? Will we see a short-term bounce before the bear takes over?
SOLUSDT.3S trade ideas

SOL/USDT May SOL lose the weekly support? Key Level to buy!Hey traders! 👋 Let’s dive into the weekly chart for SOLUSDT.
📊 Current Price Action:
SOL is trading at $112.20, down 10.96% on the weekly chart. The price has been consolidating in a "Buying Zone" between the weekly support levels of $110.17 and $131.68. This zone has historically acted as a strong base, with the price bouncing from this area multiple times since late 2023.
🟢 Buying Zone and Support:
The current price is sitting in a critical "Buying Zone" between $110.17 and $131.68. This area has acted as a springboard for previous rallies, and if SOL holds above $110.17, it could be a good opportunity for accumulation. A break below $110.17, however, might lead to further downside toward the next support at $80.18 or even $54.00.
🎯 Target:
If SOL manages to break through the $195.71 resistance, the next major target is its previous ATH at $260. I’ve projected a potential move to $295.71, which would be a 95.71% increase from the current price of $112.20. This target aligns with the historical price structure and Fibonacci extensions.
⚠️ Risk Management:
Keep an eye on the $110.17 support. A weekly close below this level could signal bearish momentum, potentially driving the price toward lower supports. On the upside, watch for a strong breakout above $195.71 with high volume to confirm the bullish scenario.
What do you think about SOL’s setup? Are you bullish or bearish on Solana? Let’s discuss in the comments!
#SOLUSD #Solana #Crypto #TechnicalAnalysis #Breakout

SOL USDT WEEKLY Sooner or later you will find Solana at one dollar.
I do not know what the news is and I do not know what will happen from Trump’s decisions or statements about currencies or about Solana, but I believe that it will go to one dollar and then rise very strongly, exceeding 400 dollars. 🤷♂️
Unless $180 breaks, this whole scenario is canceled.

SOLANA Monthly Time-frame Equilibrium before Expansion?Hello traders, in today’s analysis we are going to discuss Solana on the monthly timeframe.
Solana is approaching a key area of support where multiple technical factors align. This level could provide a strong base for a potential swing trade setup, targeting a move back toward the previous highs. If buyers step in and defend this zone, it may confirm a broader range formation on the high timeframe.
Key Points:
• Price is approaching a key support zone with strong technical confluence.
• Confluence includes the value area low, high timeframe support, 0.618 Fibonacci, and key swing lows.
• A hold at this level on a monthly closing basis could trigger a swing trade back towards the all-time high.
Solana’s price action is currently testing a critical support area that could define the next major move. If this level holds, it increases the probability of a rotation back toward previous highs, forming a potential high timeframe range.
Since this is a monthly analysis, patience is required, as each candle represents a full month. While price can take time to develop, as long as support holds, the structure favors a move higher in the long run.

Solana Correction - Is a Drop to $60 Inevitable?After an explosive 200x rally, Solana surged from its all time low at $1 to a new all time high in 2021, followed by a correction to $10 in 2022. It then made another massive run to $250 in 2024.
Now, a double-top "M" pattern is forming, signaling a reversal. As shown on the chart, we could see a drop to $60.
What's your take - has the top been set, or do you disagree with the bearish outlook? Let me know your thoughts!
Kindly support this idea with a LIKE👍 if you find it useful🥳
Happy Trading💰🥳🤗

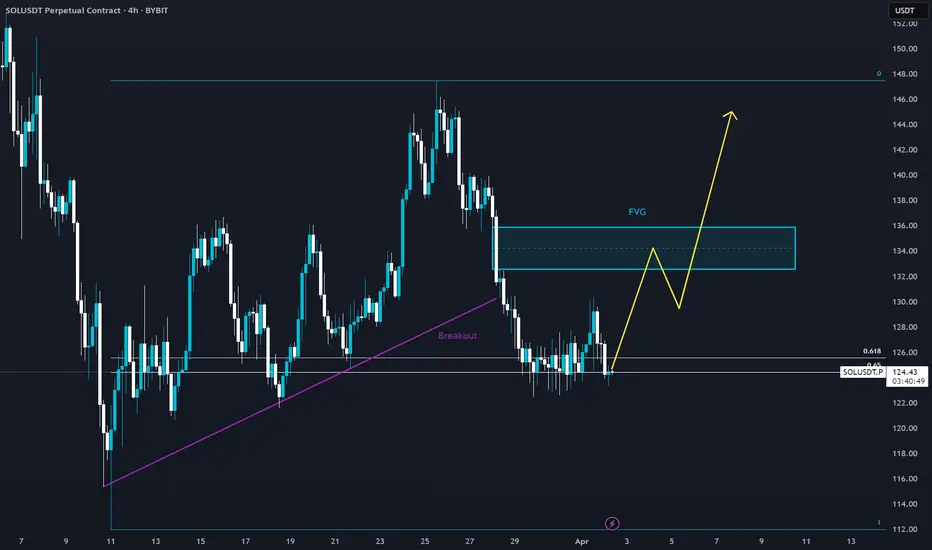
SOL - Breakout Retest & FVG Target This 4-hour SOL/USDT chart shows a breakout retest at a key support level, with a potential move toward the Fair Value Gap (FVG).
Key Observations:
🔹 Breakout & Retest: Price has broken below the trendline and is now stabilizing near support.
🔹 FVG Target: A bullish reaction from this level could send SOL toward the FVG before further continuation.
🔹 Potential Bullish Structure: A strong bounce could lead to higher highs, while failure to hold may invalidate the setup.
Will SOL confirm this bullish scenario? Let’s watch how it reacts! 📈🔥
Will SOL drop below $100?Hello Traders,
I hope you are all doing well. Here’s a quick analysis of SOL on the weekly timeframe.
After reaching its all-time high of $295, SOL experienced a 60% decline within 11 weeks. According to the chart, the support trendline remains strong, and technically, the price has not yet reached that level.
If we see a further dip toward the support trendline, SOL could drop as low as $90. However, a rebound from this level could lead to a significant upward move.
Long-Term Strategy:
✅ Accumulation: $90 to $125
✅ Trade Type: Spot
✅ Target: $300 to a new all-time high
✅ Period: By the end of Q3
🔔 Reminder: Always conduct your own research and analysis before investing. This is not financial advice.
Regards,
Team Dexter

Solana Faces Bearish Risk Below The Bearish PatternSolana Faces Bearish Risk Below The Bearish Pattern
Since our last analysis, Solana's market structure has changed significantly. With the price still below a major bearish pattern, long trades remain highly risky—at least until a clear reversal is confirmed.
From the current perspective, Solana may test the 129.50 - 133 zone before a bearish wave begins. This wave could even start today, especially with Trump’s tariffs potentially shaking up the markets.
If Solana moves lower, it may reach our bearish targets: 🎯 116 🎯 104 🎯 92
You may find more details in the chart!
Thank you and Good Luck!
❤️PS: Please support with a like or comment if you find this analysis useful for your trading day❤️

$SOL - A lookback on where we saw trend breakLower Highs in the purple box and a clear break of trend below the 200D EMA. For future reference...

Will we see 170 on Solana ?Marked the important levels in this video for this week and considered a few scenarios of price performance
Important resistance is at 145, if this level will be broken, there will be chances to see 170 on Solana. In case the correction continues, support could be considered at the level of 120
Write a comment with your coins & hit the like button, and I will make an analysis for you
The author's opinion may differ from yours,
Consider your risks.
Wish you successful trades! MURA

SOLANA(UPDATE)Hello friends
Due to the heavy price drop, you can see that buyers are slowly entering and the price is creating a good ascending channel, which now provides a good opportunity to buy in stages and with capital management and move towards the specified goals.
Don't forget to save profit on each target.
*Trade safely with us*

SOLANA at key support zone - Is $160 within reach?BINANCE:SOLUSDT has reached a major support level, an area where buyers have previously shown strong interest. This zone has acted as a key zone, increasing the likelihood of a bounce if buyers step in.
A bullish confirmation, such as a strong rejection pattern, bullish engulfing candles, or long lower wicks, would strengthen the case for a move higher. If buyers take control, the price could rally toward the $160 target. However, a decisive breakdown below this support would invalidate the bullish scenario and could lead to further downside.
This isn’t financial advice, just my take on how I approach support and resistance zones. Best to wait for clear confirmation, like a strong rejection or a volume spike, before making a move.
Every trader has a unique perspective. Let’s discuss this setup within the TradingView community!

#Sol #bulltakeover Solana Reversal!Solana is on the verge of Bullish take over and high likely it will shoot big candle from here

Solana head and Shoulders ?This pattern need to be confirmed by the second shoulder, then keep an eye on the volume, the RSI and the pattern neck line to take a trade and aim for position to TP

SOL | Accumulation Zones | BEST BUY ZONESSolana has topped out after its new ATH in January, and it has clearly marked the beginning of the bearish cycle since then.
The bearish-M pattern in quite significant in the weekly timeframe. ( More info on that pattern here, on the ETH chart ):
From a technical indicator perspective, we see a clear "sell" sign - a strong signal from a trend-based indicator:
Which every way we are heading down (stair step or pin drop), there are a few noteworthy zones to watch:
_______________________
BINANCE:SOLUSDT

Elliott Wave | Final Bullish Push Before the Big Drop? | (C) of MEXC:SOLUSDT
🔵 Elliott Wave Setup | Complete structure - Final move incoming?
The current wave structure suggests we're approaching the end of the corrective (B) wave. Price is now testing the 78.6%–88.7% Fibonacci support zone, which is a typical launch area for a bullish (C) wave.
➡️ My Outlook:
- (B) correction is nearly completed at the key Fibonacci support.
- Expecting a bullish move up into the 78.6%-88.7% target box to complete wave (C) of (b).
- After that, a strong bearish move is likely towards the "End of the bear" zone.
➡️ Trading Idea:
1️⃣ Long entry within the 78.6% – 88.7% retracement support.
2️⃣ Target: Red box area (potential top of wave (C) of (b)).
3️⃣ Prepare for a short setup after confirmation of reversal from that zone.
‼️ Risk Note:
- If the price breaks below the 88.7% level, the setup becomes invalid.
- Always use proper risk management and wait for confirmation.
💬 What do you think? Is wave (B) already complete or are we getting one more push?
#ElliottWave #ChartAnalysis #TechnicalAnalysis #Fibonacci #Crypto #Forex #Trading

Elliott Wave Analysis: One More Low Before Seeking New HighsMEXC:SOLUSDT
Currently, we are in a corrective Wave (4) within a larger impulse cycle. The structure shows a classic ABC correction, with the possibility that Wave C is not yet complete.
Key Levels:
📌 61.8% Fibonacci Retracement – A potential zone for the correction to end.
📌 Last Low (Wave C) – Expected final low before the next impulse wave (5) begins.
Expected Scenario:
🔹 A final low is needed – We should see one more dip within Wave C to complete the correction.
🔹 Bullish momentum afterward – Once the low is confirmed, I expect a strong move up toward new highs.
I'm closely watching near the 61.8% Fibonacci level for a potential long setup into Wave 5.


#SOL/USDT#SOL
The price is moving within a descending channel on the 1-hour frame and is expected to continue lower.
We have a trend to stabilize below the 100 moving average once again.
We have a downtrend on the RSI indicator that supports the upward move with a break above it.
We have a resistance area at the upper limit of the channel at 127.
Entry price: 126
First target: 124
Second target: 122
Third target: 119

Sol scalp short to $127 tonight!The market works for me
Just took a #solana short
Let's get it.
Target area $127.5- $127

SOL/USDT – Key Support Test: Will It Hold or Break?#SOL/USDT #Analysis
Description
---------------------------------------------------------------
Solana (SOL) has been in a strong uptrend since late 2023, but recent price action suggests a key test of support around the $115–$135 zone. This level was previously a major resistance and is now being retested as support.
Moving Averages: The price has dipped below the shorter EMAs but is still above the long-term moving average.
Bearish Momentum: The recent sharp drop suggests selling pressure, but the support zone could lead to a reversal.
Two Scenarios:
🔼 Bullish: If the support holds, SOL could bounce back towards $180+ and continue its uptrend.
🔽 Bearish: If support breaks, a deeper correction to $43–$60 is possible.
📊 Trading Strategy
Long Entry: If a strong bounce occurs from the $115–$135 zone, targeting $180+.
Short Entry: A confirmed breakdown below $115 could trigger a move toward $60 or lower.
---------------------------------------------------------------
Enhance, Trade, Grow
---------------------------------------------------------------
Feel free to share your thoughts and insights. Don't forget to like and follow us for more trading ideas and discussions.
Best Regards,
VectorAlgo

SOL for SOUL - Will it claim $170?As said and depicted, 145 is inevitable! just let it come to the range of 120 to 115 for best buys!
