Crypto BARTBears have been burnt a lot, now everyone is Long
95%+ Retracement for another Rally after taking all liquidity
SOLUSDT.3S trade ideas

SOLANA LONGLooking very bullish right now . Strong demand zone formed around 120 price region.
Long position here. At least 240 .

SOLANAAfter getting stopped out on BE on the LTF trend break, Ive eyed on another entry on SOLANA, you can see a clear 4H order block being untapped, I will be placing an entry on the body of this order block and targeting previous swing highs as seen on the chart resulting in a nice 3:1 RR
Goodluck

SOL Bulls Strike Back — But Is It Sustainable?Solana continues to respect technicals with precision — after a +42.9% move from the $95 low, we're now at a pivotal moment in price structure. Let’s break down what’s happening and where the high-probability setups lie.
📍 Key Bounce Zone – Golden Pocket Confluence
Local Low: $95.26
Golden Pocket Zone (0.618–0.666): $97.09–$94.82
This area acted as a major demand zone, with price sharply rebounding.
First Volume Spike: Followed by retracement into Golden Pocket Zone at $102.
Second Volume Spike: Occurred right after touching Anchored VWAP ($108.21) from the $95.26 low, which added beautiful confluence with the Golden Pocket Zone – a secondary high-conviction long entry.
📈 Rally to Resistance – Short-Term Climax
After the anchored VWAP retest, SOL rallied into the key resistance zone aligned with the 0.786 Fib retracement from the previous down move — a historically reactive level and a prime profit-taking zone.
Monthly 21 EMA ($135.83) and the monthly 21 SMA ($133) — both key dynamic resistance zones.
Low-volume retest of that key high suggests buyer exhaustion, not continuation — a classic setup for a short-term reversal.
🧭 Current Market Structure
Current Price Action: Trading above both the weekly open ($128.38) and the monthly open ($124.54).
This forms a critical S/R zone between $124–$128, now acting as a potential battleground for bulls and bears.
As long as price stays above this zone, momentum remains with the bulls.
🔍 What to Watch Next – Reclaim or Reject?
Key Support to Watch:
$125 (psychological level) and monthly open at $124.54 – This zone is likely to be liquidity-hunted. Expect a sweep of this low, look for the reaction.
Daily Support Confluence: currently at 21 EMA: $123.77 & 21 SMA: $123.27
1.) 📈 Scenario A – Bullish Reclaim:
If SOL sweeps the low and shows strong buying reaction (bullish engulfing candle, volume spike), it sets up a potential long opportunity towards the weekly open, to watch for the next reaction.
2.) 📉 Scenario B – Failed Hold:
If there's no bullish reaction at $124–$125, expect further downside.
First target = $122
Second target = $120.65
🎯 Tactical Game Plan
Bulls:
Watch for reaction at $124–$125 – potential scalp long with tight SL.
Confirmation on volume expansion and break of $128.38 for continuation.
Re-enter long after clean retest of weekly open from above.
Bears:
Short setup possible if weekly/monthly open is broken and retested as resistance.
First TP = $122, second TP = $120.65.

SOLUSDT Holding Support, Targeting $150BINANCE:SOLUSDT bounced perfectly from the 0.618 Fib level and is now testing resistance. A small dip back to support is possible, but if $110 holds, we could see a strong move toward $150. Compared to other altcoins, SOLUSDT is showing real strength. Once the tariff noise clears, this could be one of the top performers. Always manage risk and set your stop loss!
BINANCE:SOLUSDT Currently trading at $118
Buy level: Above $112.5
Stop loss: Below $100
Target : $150
Max Leverage 3x
Always keep Stop loss
Follow Our Tradingview Account for More Technical Analysis Updates, | Like, Share and Comment Your thoughts

keep an eye on $130!Solana has broken the 90 days downtrend line, which is very bullish for it. But it is struggling with $130, which is a weekly really strong resistance. If it could break this level, there is a possibility to pump to $160 and maybe start a correction from there. Otherwise it would correct to $100, which is a strong support level. So keep an eye on $130!

SOLANAShorting solana on this HTF trend break, as you can see on the chart, My entry sits on the body of the hourly bearish orderblock. However, this is a riskier setup, therefore risk no more than 0.5% of your capital if you wish to enter.
Goodluck

$SOL/USDT Trading Plan (2D TF)$SOL/USDT Trading Plan (2D TF)
Demand zone breakout = Bullish confirmation ✅
Target: $130 → $265+
Buy the dip plan: $75–$130 zone
Leverage: x5–x10 (Futures)
Price broke falling trendline and retested demand – looking for long setup.
Risk-managed entries for breakout or dip buys.

SOL/USDT:BUY...Hello friends
Due to the heavy price drop we had, the market fell into fear and at the specified support, buyers supported the price, which is a good sign that we should buy within the support ranges with capital and risk management and move with it to the specified targets.
Always buy in fear and sell in greed.
*Trade safely with us*
SOLANA (SOL/USDT) – TP: 170 - 252 & 295SOLANA (SOL/USDT) is currently trading at $130.17 after rebounding from a well-defined sell-side liquidity zone between $98 and $131. The recent weekly candle shows a strong bullish recovery (+22.93%), suggesting that liquidity has been swept and buyers are stepping in. This level has historically served as a key accumulation zone, and the bounce aligns with oversold conditions on the StochRSI, which is now curling upward — indicating growing bullish momentum. If price sustains above the $125–131 level, the next immediate upside target lies between $170 and $188, where prior supply and consolidation occurred. A confirmed breakout above this range opens the path toward a higher resistance zone between $254 and $295 — a region that aligns with unfilled inefficiencies and previous price distribution.
The ideal swing trade approach would be to enter on a pullback within the $110–125 range, set a stop loss below $98, and scale out at the $170 and $254 levels. This setup offers a favorable risk-to-reward ratio of approximately 1:3.5.
Trade Strategy Suggestion (Swing or Positional):
Entry: Ladder between $115–$125 on retrace
SL: $105–110 (below wick low)
TP1: $170–188
TP2: $254–295
Scaling Out: 50% at TG1, rest at TG2 or trail stops above $200
With macro tailwinds like renewed interest in Solana’s DeFi and meme coin ecosystems, institutional flow returning, and technical confirmation across multiple timeframes, this could be a high-conviction mid-term play for swing traders and positional investors alike.
🔮 Narrative & Fundamentals:
ETH L2 congestion → SOL gets transactional inflows
SOL’s DeFi, NFT, and memecoin activity resurging (e.g., SEED_WANDERIN_JIMZIP900:WIF , SEED_DONKEYDAN_MARKET_CAP:BONK ecosystem)
Institutional flow picking up (Grayscale SOL trust rallying)
SOL remains one of the fastest L1s with growing developer traction

SOL/USDT – Potential Final Leg Down Before Major RallyBINANCE:SOLUSDT 🚀📉🔁
We are likely approaching one of the final moves down before a significant push higher. But before that, I expect one last move up to the $142 area, forming what I believe is a Red ABC corrective structure.
🔴 Red Wave A-B-C
Red Wave A has likely already completed, confirmed by a clean White ABC move.
We are now inside Red Wave B.
✅ Ideal Long Entry Zone
The ideal entry would be near the 88.7% Fibonacci retracement, which aligns with Green Wave B around $119.4.
From that level, I expect a drop down toward $100, completing Red Wave B.
🔄 What Comes After?
From the $100 zone, two possible scenarios for Red Wave C (or Wave 1 of a new impulse):
A 1-2-3-4-5 impulsive wave structure to the upside
Or a corrective A-B-C structure
We’ll need to carefully watch the first move out of the $100 zone:
A 5-wave move would suggest a new bullish impulse has begun
A 3-wave move might just be a larger corrective rally
🎯 Upside Target: $142
Once we hit $142, I anticipate another corrective move downward.
This could take the form of:
A clean ABC
A complex correction (A-B + 1-2-3-4-5)
Or even a direct impulsive 5-wave drop
Again, the key is watching the first leg down from $142 – whether it's impulsive or corrective will define the entire next phase.
⚠️ Summary:
Current focus: Entry near $119.4 (88.7% Fib), targeting $142
Caution: Expect volatility – structure will only become clear wave by wave
Watch: Reactions at $100 and $142 for structure confirmation
Let me know what you think below!
Like & follow if you enjoy deep EW breakdowns!

Elliott Wave Analysis 🔹 Wave Structure:
The chart shows a clear corrective structure unfolded, currently developing as a complex correction (likely WXY or an ABC):
Wave A: Strong impulsive move to the downside
Wave B: Ongoing corrective rally (possibly a flat or zigzag)
Wave C (anticipated): Final downward leg yet to unfold
🟩 A green target box marks the potential end zone of the correction, aligning with a horizontal support level around 85.35.
📊 Indicators:
🔸 MACD:
Currently showing a bullish crossover (MACD line above the signal line) → supports the idea of a temporary B-wave rally.
Momentum is not very strong → another hint that the move might be corrective, not impulsive.
Watch for a bearish crossover as a possible trigger for the start of Wave C.
🔸 RSI:
RSI is recovering from lower levels, signaling short-term strength.
No overbought condition yet → allows more room for the B-wave to extend.
Key Watch: If RSI enters overbought territory while MACD turns down, it could mark the start of the C-wave drop.
🎯 Summary & Outlook:
We are likely in the final phase of Wave B.
Expectation: One last downward move in Wave C towards the green zone.
That area could offer a strong long opportunity, but only after clear confirmation (e.g., divergence, impulsive reversal, rising volume).
📌 Potential Strategy:
❌ No long entries yet – risk of another drop in Wave C.
🔔 Set alerts around 85–60 – monitor for reversal signs.
📈 Upon confirmation: potential entry for the next larger impulsive wave.

CLAIM your SOUL for SOL!As analysed, the doodle says this, go for it? or let that short slowly chuck you to liquidation?

LONG SOL TP 125 CONFIRMED.long sol at 115 which is current price,Confirmations vwap,support of emas at lower tfs,has to retest at daily ema,vwap is postive,so faris RSI,Bullish engulfing candle hs been made another confirmation,there is 1 thing about me i dont make wild guesses,I give calls on Confirmations so there you go LONG at 115 tp at 125 Thanks,over n out

$SOL Weekly Bounce from Dynamic Support – Watch for BreakoutCRYPTOCAP:SOL is holding above a key rising trendline that has acted as strong support since 2021. After a successful retest near $95–$100, SOL bounced sharply and is now trading above $120.
This move also confirms a reclaim of a previous resistance-turned-support zone. As long as it holds, SOL could aim for $145 and above.
DYOR, NFA

#Solana: Speed, Scalability & Ecosystem Power**Description**:
This trading idea is based on **Solana (SOL)**, one of the fastest and most scalable layer-1 blockchains in the cryptocurrency space. Known for its low transaction fees and lightning-fast processing speeds, **Solana** supports a thriving ecosystem of decentralized applications (dApps), NFTs, DeFi platforms, and GameFi projects. Its high-performance architecture attracts developers and users seeking efficiency without compromising decentralization. Backed by strong institutional interest and community support, **SOL** continues to stand out as a key player in the race for blockchain adoption and innovation.
Despite its technological strengths, Solana, like all cryptocurrencies, is exposed to high market volatility, potential network outages, and evolving regulatory landscapes. Investors should be aware of these dynamics before entering the market.
**Disclaimer**:
This trading idea is intended for educational purposes only and does not constitute financial advice. Investing in cryptocurrencies like **Solana (SOL)** involves significant risk, including the potential for total loss of capital. Always conduct in-depth research, assess your risk tolerance, and consult a financial advisor before making any investment decisions. Past performance is not indicative of future results.

SOLUSDT NEXT MOVESell after bearish candle stick pattern, buy after bullish candle stick pattern....
Best bullish pattern , engulfing candle or green hammer
Best bearish pattern , engulfing candle or red shooting star
NOTE: IF YOU CAN'T SEE ANY OF TOP PATTERN IN THE ZONE DO NOT ENTER
Stop lost before pattern
R/R %1/%3
Trade in 5 Min Timeframe, use signals for scalping

SOL preppin for a 300 revisit from this 100 bargain zone. SEED!SOL has been on rollercoaster ride the past few months -- going from 100 to almost 300 in a zoom when the market is at its peak.
Moreso, when memes started taking over the market and everyone, including the president himself is launching one on SOL blockchain, market started pickup up pace and eliciting euphoria among all, albeit momentarily. It has stirred up some hype and frenzy skyrocketing prices only to be met with so much saturation and gravity, then the BIG BLEED happens.
After a few weeks thing seem to have settled down -- a shift is gradually transpiring as we speak. SOL is now exhibiting some basing behavior at this current range at 100 levels. Net longs has started to pile up around this zone conveying a prep work of upside reversal soon.
Long term metrics suggests a tap at 61.8 FIB levels - a buyers convergence zone. This is where it all starts.
Ideal seeding is at the current discounted price range.
Spotted at 110
Mid target 300.
Long term 500.
TAYOR. Trade safely.

Solana Update: To Buy Or Not To Buy? Hold Or Sell?Here is an update on Solana.
The chart has the same numbers as before but the support line has been moved to match the 5-August 2024 low. The action is happening right above this level.
While Solana trades above its August 2024 low, the action is considered bullish. Below this level and we are certainly bearish. Being bearish in this way does not change the long-term outlook, bias and perspective, we are set to grow long-term based on a broader trend and bigger cycle. This is a closer look.
The low in April is a shy lower low compared to March. This is always important. Notice the steep decline. This is a bearish impulse, prices tend to move down fast and strong. When bearish momentum starts to die down, we see patterns like the one we have on the chart above. Some shaky action and then a lower or higher low. The market (SOLUSDT) is preparing to change course.
The correction is present since November 2024. For Solana, the higher high in January 2025 is part of a complex correction, an extended flat. 3-3-5 wave in Elliott terms.
This is irrelevant. The point is that once the correction is over prices tend to grow.
Consider this, between June and September 2024 we have more than three months of consolidation. The market garnered enough strength to produce a bullish wave. It took a while but it happened. Then there is a correction and this bullish wave was erased by more than 100%.
If buyers showed up at a price of $100, $120, $130 and even $150 in the past, they can definitely show up again. Now that the bullish move has been erased, we are back to square one, the starting point, the base; from this point forward Solana can grow again.
Solana looks weak right now on the very, very short-term. But do not let this deceive you, we are going up next. Focus on the long-term.
Accumulation can be done each time prices hit support.
What happens if I buy and prices move lower?
Wait patiently. If you have capital available, buy more.
And if it drops again? Keep waiting, continue buying.
You will be happy with the results once the market turns.
Thank you for reading.
Patience is absolutely key.
If you didn't sell at $290, $280 or $250, why would you sell when prices trade at $100? It makes no sense.
Buy when prices are low and hold.
Only sell when prices are moving higher.
Namaste.

Anyone for SOL ?I would like to see this happen for SOL , would you ?
I bet you would ;)
Comment Like and Share

SOL — Clean Liquidity Grab & FVG Flip. Mid-Term Setup in PlayClassic move on SOL — liquidity sweep, inverted the FVG, and pushed higher. Textbook stuff.
Not expecting an instant pump, this one looks more like a mid-term play… although, with SOL, you never know.
Stay sharp. And follow to catch the next ones early.
Entry: 109
TP: 123-148

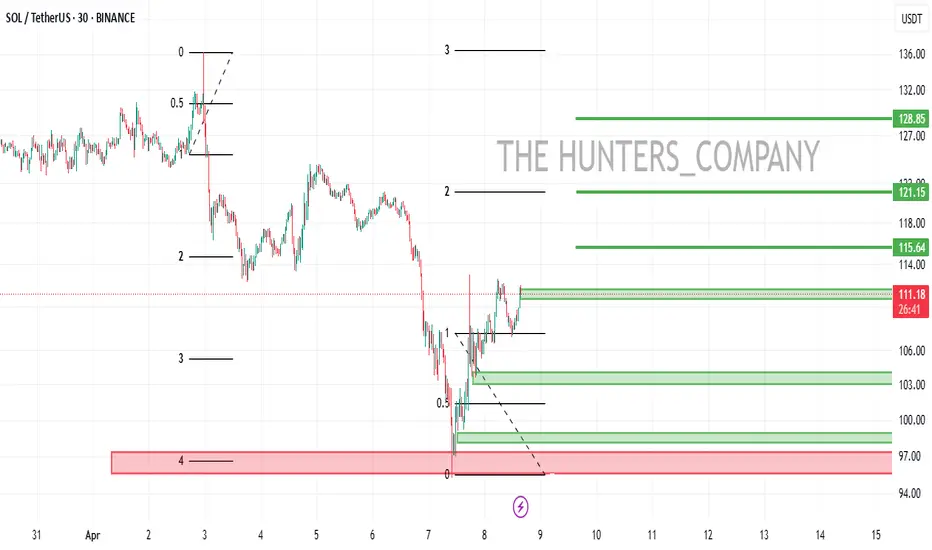
SOL Long from 103As You can see on 6h tf we have 2 mentioned LOWS which are refering not only sol is on support but also vwap confirmation on MARKET CIPHER and bullish divergence VWAP 6H and 24m TF,SOL will cover fair value gap upwards first then heads down but mean while we have a good trade on our hands,TP and SL are Mentioned.Drop like Comment if You get profits Thanks

SOLUSDT 1DSOL ~ 1D Analysis
#SOL Buy gradually after successfully penetrating this resistant line with a short -term target of at least 10%+.
