STPTUSDT trade ideas

STPTUSDT – One of Today’s Highest Volume Gainers!🔴 Key Resistance Zone:
The red box marks the first major resistance area, where sellers are likely to step in aggressively. This is where weak hands get trapped, and smart money makes its move.
📉 How to Trade This Like a Pro:
✔ Short Bias: If price rejects from this zone, I will look for lower time frame confirmations to short. No confirmation, no trade.
✔ Break & Retest: If price breaks above with volume and gives a clean retest, I’ll consider a shift in bias and potentially look long.
🔥 Why You Need to Follow Me:
I don’t trade like everyone else. I have secret protocols that allow me to stay ahead of the game, securing the highest win rate in the market. Others guess—I execute with precision.
📌 Stay Ahead or Get Left Behind:
Most traders have no idea how to trade these setups properly, but that’s exactly why I consistently win while they struggle. Follow closely, don’t miss out on the next big move.
📌I keep my charts clean and simple because I believe clarity leads to better decisions.
📌My approach is built on years of experience and a solid track record. I don’t claim to know it all but I’m confident in my ability to spot high-probability setups.
📌If you would like to learn how to use the heatmap, cumulative volume delta and volume footprint techniques that I use below to determine very accurate demand regions, you can send me a private message. I help anyone who wants it completely free of charge.
🔑I have a long list of my proven technique below:
🎯 ZENUSDT.P: Patience & Profitability | %230 Reaction from the Sniper Entry
🐶 DOGEUSDT.P: Next Move
🎨 RENDERUSDT.P: Opportunity of the Month
💎 ETHUSDT.P: Where to Retrace
🟢 BNBUSDT.P: Potential Surge
📊 BTC Dominance: Reaction Zone
🌊 WAVESUSDT.P: Demand Zone Potential
🟣 UNIUSDT.P: Long-Term Trade
🔵 XRPUSDT.P: Entry Zones
🔗 LINKUSDT.P: Follow The River
📈 BTCUSDT.P: Two Key Demand Zones
🟩 POLUSDT: Bullish Momentum
🌟 PENDLEUSDT.P: Where Opportunity Meets Precision
🔥 BTCUSDT.P: Liquidation of Highly Leveraged Longs
🌊 SOLUSDT.P: SOL's Dip - Your Opportunity
🐸 1000PEPEUSDT.P: Prime Bounce Zone Unlocked
🚀 ETHUSDT.P: Set to Explode - Don't Miss This Game Changer
🤖 IQUSDT: Smart Plan
⚡️ PONDUSDT: A Trade Not Taken Is Better Than a Losing One
💼 STMXUSDT: 2 Buying Areas
🐢 TURBOUSDT: Buy Zones and Buyer Presence
🌍 ICPUSDT.P: Massive Upside Potential | Check the Trade Update For Seeing Results
🟠 IDEXUSDT: Spot Buy Area | %26 Profit if You Trade with MSB
📌 USUALUSDT: Buyers Are Active + %70 Profit in Total
🌟 FORTHUSDT: Sniper Entry +%26 Reaction
🐳 QKCUSDT: Sniper Entry +%57 Reaction
📊 BTC.D: Retest of Key Area Highly Likely
📊 XNOUSDT %80 Reaction with a Simple Blue Box!
📊 BELUSDT Amazing %120 Reaction!
I stopped adding to the list because it's kinda tiring to add 5-10 charts in every move but you can check my profile and see that it goes on..

Trading opportunity for STPTUSDTBased on technical factors there is a Buy position in :
📊 STPTUSDT
🔵 Buy Now
🪫Stop loss 0.04200
🔋Target 0.06450
📏 R/R 3
💸RISK : 1%
We hope it is profitable for you ❤️
Please support our activity with your likes👍 and comments📝

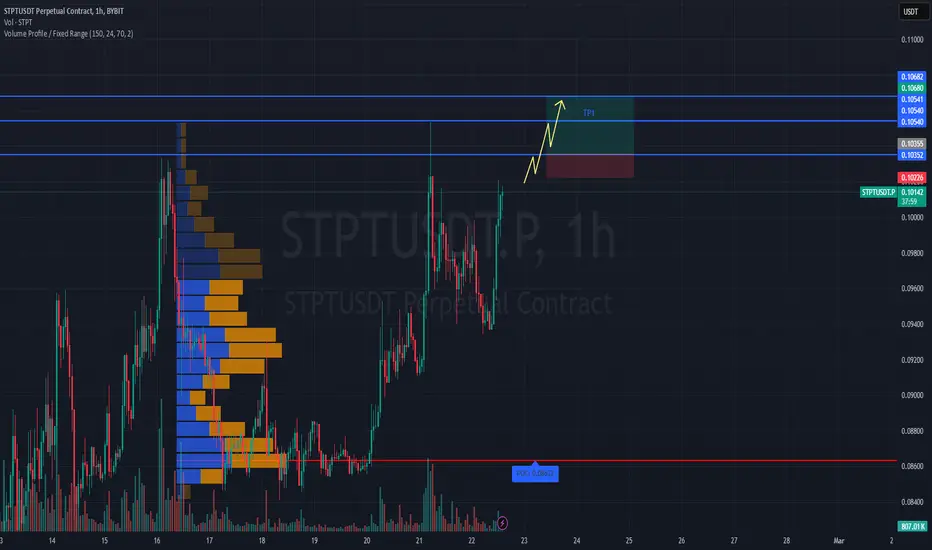
#STPTUSDT maintains bullish momentum📈 LONG BYBIT:STPTUSDT.P from $0.10355
🛡 Stop Loss: $0.10226
⏱ 1H Timeframe
✅ Overview:
➡️ BYBIT:STPTUSDT.P is showing strong bullish momentum after consolidating at lower levels, indicating buyer presence.
➡️ Volume Profile suggests that the main liquidity (POC) is positioned significantly below the current price, confirming demand dominance.
➡️ A breakout above $0.10355 and holding above this level will validate the bullish continuation.
➡️ The nearest resistance zone is between $0.10540 and $0.10680, where partial profit-taking may occur.
⚡ Plan:
➡️ Long entry upon breaking $0.10355, confirming buyer strength.
➡️ Stop-Loss at $0.10226—placed below the nearest support to minimize risk.
➡️ Main target range: $0.10540–$0.10680, where selling pressure might emerge.
🎯 TP Targets:
💎 TP 1: $0.10540
🔥 TP 2: $0.10680
🚀 BYBIT:STPTUSDT.P maintains bullish momentum — expecting further upside!
📢 BYBIT:STPTUSDT.P remains within an uptrend. If the price consolidates above $0.10355, further acceleration is expected.
📢 Volume suggests strong buyer activity, supporting the bullish outlook.
📢 However, the $0.10540–$0.10680 zone could act as a profit-taking level, so monitoring price action and partial profit-taking is advisable.
Corrections Are Good, For TA: STPT Can Do An Easy 100%The correction here reveals that all the selling has already been done. And this is good, because once the selling is over we can expect prices to grow.
This pair, STPTUSDT, can easily give 100% without considering a new high.
A new high will happen because we have a higher low and we are in bull-market year.
So short-term there can be fast growth but long-term there can be strong growth.
You can choose to buy and sell just as you can choose to buy and hold.
Opportunities are endless. A portion of your capital can be used for short-term trades, while another portion can be used for long-term trades. An even smaller portion can be used for leveraged trades. The major portion of your capital should be on strong projects, spot, focused on the long-term.
That's the way to succeed in this market.
Is it?
Thank you for reading.
Namaste.

STPT/USDT Long Trade Setup – Key Levels
**🚀 📊**
- **SL (Stop-Loss):** 0.09744 🔴
- **Entry:** 0.11060 🟡
- **T1 (Target 1):** 0.12922 🟢
- **T2 (Target 2):** 0.14908 🟢
👉 Confirm price support and breakout continuation before entering. Manage your risk effectively! 💹
#STPTUSDT #CryptoTrading #LongTrade #TechnicalAnalysis #TradingSetup #CryptoMarket #RiskManagement

STPTUSDT (STP) Updated till 15-01-25STPTUSDT (STP) Daily timeframe range. we can see 2 wicks toward 0.08291 thats buyers trying to clear out sellers on resistance. if retail interest keeps up its not hard to get over 0.08291. its holding well even through market dump till now. recent support at 0.06287.

STPT - LONGTrend movements:
The chart clearly shows cycles of growth and correction, which help us understand key support and resistance levels.
Correction phases:
These are the moments (highlighted in red) where the price consolidates before the next upward movement. Such zones usually create potential for a breakout.
Target level:
My forecast suggests a potential price increase of +12.58% with a target level of 0.08050 USDT.
What’s important:
Keep an eye on the confirmation of a breakout from the consolidation zone. This could be a great entry opportunity.

Prepare to BUY Spot STPTUSDT (D1 Cycle)Prepare to BUY Spot STPTUSDT (D1 Cycle)
🌟 Short-Term Opportunity with STPTUSDT! 🌟
🌍 Market Overview:
STPTUSDT is showing bullish signals on the D1 timeframe, making it an ideal candidate for short-term gains.
📊 Trade Plan:
📌 Entry Point: $0.054 - $0.056 – Accumulate within this range for optimal positioning.
or set up an alert for BUY signals on D1 to ensure precise entry.
🎯 Target: +20% to +50% – Aiming for strong short-term returns.
⏳ Hold Time: 5-7 days – Strategically aligned with the D1 cycle.
💡 Note: This is not financial advice. Always DYOR before trading.
🔥 STPTUSDT is ready for action – Position yourself for the move! 🔥

Bullish Altcoins (1,000%+ Growth Potential)Here is an example of a pair that is green now and ready to grow. Notice that this one is part of the small caps.
Like this one, there are many, many Altcoins/pairs that are ready to move ahead.
This pair can easily produce 300-500% but total growth potential goes beyond 1,111%.
The market bottom was hit in November 2022.
A long-term higher low happened in August 2024.
We have a small bullish breakout, local resistance being challenged, and now the pair is ready to move ahead.
It can start moving within weeks just as it can take only a few days.
While the big market cap. projects correct and go sideways, the small can easily grow.
This is just an example, but we have hundreds of these building up and ready to grow.
The time to buy is now.
When prices are moving it is already too late.
We have to buy and hold, wait patiently and the market takes care of the rest.
When there is no excitement;
When the pairs are trading near support; That's the best time to buy to enjoy maximum growth.
Thanks a lot for your support.
Namaste.

STPT Bullish on MonthlySTPT will give 400% plus profit .. u must allocate some funds in this project

Crypto Pick of the Day: STPTUSDT (Spot)🌟 Crypto Pick of the Day: STPTUSDT (Spot)
Market Overview:
STPTUSDT is trading at a key level on the D1 timeframe, presenting an excellent buying opportunity. With strong short-term momentum expected, this setup offers a chance for significant gains within a week.
Trade Plan:
📌 Entry: Around $0.06 – Perfect price to enter before the potential rally.
🎯 Target: 70% profit (~$0.102) – Aiming for substantial returns.
⏳ Horizon: Max 1 week – Quick turnaround for a profitable exit.
About My Indicator:
I use RainBow MG3, my custom tool, combined with D1 signals to ensure precise entry and exit points for high-probability trades.
👉 Interested in using this tool? Reach out to me for more details!
💡 Disclaimer: Not financial advice. Always do your own research.

STPTUSDT(STP) Updated till 16-09-24STPTUSDT(STP) Daily timeframe range. we can see a huge wick on daily candle today. peoples gonna get trapped if its not get to 0.06043 again. but if it can stay above 0.04803 than it got chances for another push to 0.06043 . local support at 0.03716.

STPT Long-Term Higher Low, What Now?Hello my friend, let's review another chart and this time we have STPTUSDT.
What does it say?
In August 2024 a major low was hit, this low ended up higher than the low that was hit more than a year prior in June 2023, thus we have a higher low.
Still, it looks tricky?
➖ Will it grow if Bitcoin goes down?
➖ Will it grow regardless of Bitcoin?
➖ Will it crash if Bitcoin drops?
Don't worry about Bitcoin, we are looking at STPTUSDT.
The higher low is a strong positive signal. Technically speaking we are looking at a double-bottom because of the nearness of the price between each date.
There is no need to speculate as to what can or might happen, we know exactly what is happening now by looking at the chart.
STPTUSDT is bullish now and has bullish potential as long as it trades above the June 2023/August 2024 low/support. If it moves below this level/line, there can be one final drop before higher prices. While it trades above it, the bulls are in control.
Right now this is a bullish setup and we can expect higher prices. This can be traded with a tight stop-loss.
There is no volume on the drop. If there is a flash crash or something sudden or unexpected, it is likely that the support will hold. All that is needed now is patience to win.
Buy and hold is the strategy. Regardless of what happens, with buy and hold this is an easy win.
Buy and hold and wait for 6-8 months... See how everything will turn out if you wait long enough.
Patience is key.
Think long-term.
Thanks a lot for your support.
Namaste.

STPT - +41% upside with RR of 1:2.5Multiple support found on the bottom zone.
Trendline on the verge of breaking up
RR = 1:2.5
Key momentum shift identified on the RSI after bottom out in June.

#STPT/USDT#STPT
The price is moving within a bullish channel pattern on the 12-hour frame, which is a strong retracement pattern
We have a bounce from a major support area in green at 0.03550
We have a tendency to stabilize above the Moving Average 100
We have an upward trend on the RSI indicator that supports the rise and gives greater momentum, upon which the price is based higher at the discount
Entry price is 0.4000
The first target is 0.04832
The second target is 0.05365
The third goal is 0.06020

STPTUSDT is Ready for the Next Big Move? Get Ready for BreakoutYello Paradisers! Are you ready for the next big move in #STPT? Let's break down these statements and analyze what's happening:
💎#STPT is currently trading within a descending channel, which typically signals a bearish trend. This pattern showcases a series of lower highs and lower lows. However, there’s a potential breakout and retest zone just above the descending resistance. A successful breakout and retest could lead to a strong upward move.
💎#STPTUSDT has been consistently rejected by the channel as indicated by the red arrows. A break above this line could signal a potential trend reversal. 50EMA is also reinforcing this bullish outlook.
💎There's a highlighted support zone around $0.03737, this level has been tested and respected multiple times by the GETTEX:STP , making it a crucial support area to watch. It’s also where we find a bullish order block, suggesting that buyers are likely to step in at this level.
💎Within the support zone, this order block indicates strong buying interest, providing further support for a potential bullish move. The bullish outlook will be invalidated if the $STPT falls below the major support zone at $0.03565. This level is key for maintaining the current structure.
Stay focused, patient, and disciplined, Paradisers!
MyCryptoParadise
iFeel the success🌴

STPTUSDT 1D#STPT has formed a falling wedge pattern on the daily chart. In case of a breakout, the targets are:
$0.04964
$0.05731
$0.06352
$0.06972
$0.07855
$0.08980
Support: $0.03723

BUY STPTBased on the provided chart for STPT/USDT on a 4-hour timeframe from Binance, here's a detailed trading plan:
### Entry Point
- **Entry Zone**: Between 0.04274 and 0.04632 USDT
- This range represents a significant support zone where the price is likely to find buying interest.
### Target (Take Profit) Levels
- **First Target (TP1)**: 0.06971 USDT
- This level is around the 50% Fibonacci retracement, which often acts as a strong resistance.
- **Second Target (TP2)**: 0.07885 USDT
- This level is a higher resistance zone and aligns with previous price action and the 38.2% Fibonacci retracement.
### Stop Loss
- **Stop Loss**: 0.03983 USDT
- This stop loss level is set below the support zone to protect against a deeper downside move.
### Key Levels and Observations
- **Resistance Levels**:
- 0.06193 USDT (61.8% Fibonacci retracement)
- 0.06723 USDT (50% Fibonacci retracement)
- 0.07254 USDT (38.2% Fibonacci retracement)
- **Support Levels**:
- 0.04806 USDT (local support)
- 0.04274 USDT (stronger support)
### Technical Indicators
- **RSI**: Currently around 49.34, indicating a neutral market with no strong overbought or oversold conditions.
- **Order Blocks (OB)**:
- Red zones indicate significant resistance areas to watch for potential take profits or reversals.
### Chart Patterns and Analysis
- **ABCD Pattern**: This pattern suggests that the price has completed a significant move and is likely to retrace to a Fibonacci level before resuming its trend.
- **Descending Channel**: The price is currently within a descending channel, indicating a potential reversal once it breaks out of this channel.
### Trade Plan Summary
1. **Enter** the trade within the 0.04274 to 0.04632 USDT range.
2. **Set Stop Loss** at 0.03983 USDT to manage risk.
3. **Target Levels**:
- **First Target (TP1)** at 0.06971 USDT.
- **Second Target (TP2)** at 0.07885 USDT.
Always remember to manage your risk appropriately and adjust your trade parameters based on market conditions.

STPT buy setupBy maintaining the green range, it can break the trigger line and move to the red box.
On the chart, we have a bullish iCH, which can be the first sign for a pullback towards higher supplies.
The target is the red box.
Closing a 4-hour candle below the invalidation level will violate the analysis.
For risk management, please don't forget stop loss and capital management
When we reach the first target, save some profit and then change the stop to entry
Comment if you have any questions
Thank You

STPT Finishing Correction
The thesis of an impulsive wave which is being corrected is solid. Ideally, we'd see another test of recent lows before regaining the uptrend.
This scenario invalidates if 0.04764 is breached.

STPT/USDT I BUY SETUP✔︎📈 BINANCE:STPTUSDT SIGNAL
✔︎ENTRY : 0.5830
🏓TARGETS :
✔︎T1 : 0.07336
✔︎T2 : 0.07772
✔︎T3 : 0.08311
✔︎Long term T4 - T5
✘STOP : 0.06534
🚦Stop Trigger:
• If you make capital management: Stop is activated when one candle opening and closing
below the stop level of the same time frame of the signal.
• If you don't make capital management: Stop is direct without waiting for the candle to close.
💡Risk management :
• Enter the trade with 10% to 20% of your capital to reduce risk and save cash to enter other opportunities.
• Sell (25% to 50%) on (T1) and don't move your stop-loss.
• Sell 50% on (T2) and move your stop loss to the entry point.
• You are safe now, and the next 25% is up to you.
💡Reason for this trade:
BINANCE:STPTUSDT gives my trading system a sign of strength:
• My trading system is based on liquidity and reversal zones.
• When the liquidity is swept from one side under certain conditions, we will wait for the price on the other side.
The liquidity will attract the price like a magnet.
• the first side that has been swept:
1- failure swing point
2- retest AMT
• Opposite side targets:
1- previous quarterly high
2- Successful auction (AMT)
💡Entry setup
1- reclaim Successful auction (volume profile VAH)
⚠️WARNING:
• I'm not a financial advisor.
• Do your own research (DYOR).

