Bullish Bias Confirmed —Marketwide Bullish AltcoinsStratis (STRAXBTC) is producing the highest volume ever today to break above resistance. The action we are seeing now on this pair is also the strongest bullish action ever. This can be translated as the start of a major bullish wave, which means that there will be additional growth. This is awesome.
I am seeing some of the major Altcoins going down today and some of the minor Altcoins going up. This means that money is flowing from the big ones to the small ones; this means that the Altcoins market, the small and medium-sized ones, is about to experience a massive run. This is all better than great.
We can assume that the giants will continue to consolidate, move sideways, while the smaller ones grow. Remember, the market is set to consolidate but with tens of thousands of Altcoins, some can grow will others don't.
Choose wisely.
Thanks many for your insistent support.
Namaste.
STRAXBTC trade ideas

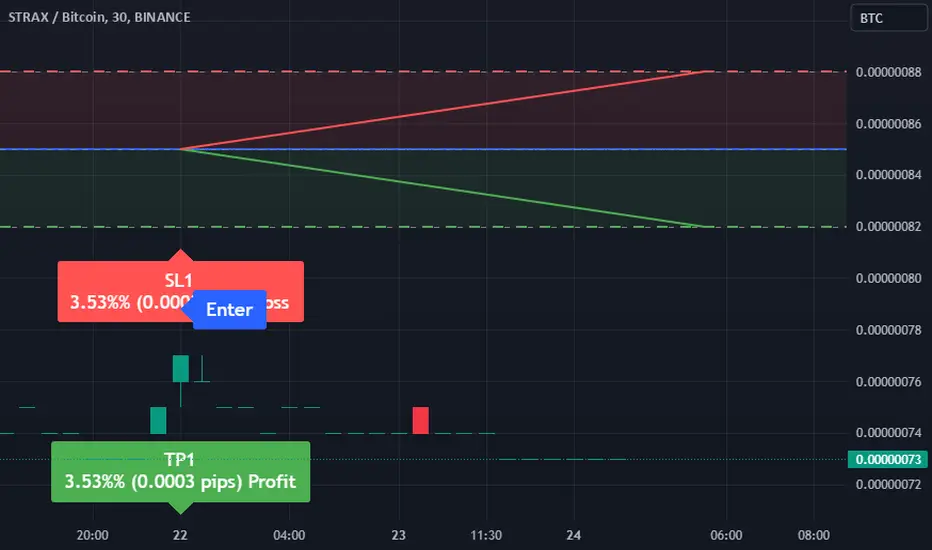
Sell Signal for STRAXBTCDear Traders,
We have identified a trading opportunity for the STRAXBTC pair with a Sell direction using our EASY Quantum Ai strategy. Here are the details:
Direction: Sell
Enter Price: 8.5E-07
Take Profit: 8.2E-07
Stop Loss: 8.8E-07
This signal is generated based on several analytical factors. Firstly, STRAXBTC has been showing signs of weakening momentum in its recent movement patterns. Our EASY Quantum Ai strategy has signaled a bearish trend due to a few core factors:
1. Technical Indicators: Some key technical indicators, such as RSI and MACD, reflect overbought conditions, suggesting potential for downward corrections.
2. Market Sentiment: Analysis of recent news and trading sentiments reveals a bearish mood in the market, likely to exert further downward pressure on STRAXBTC.
3. Volume Analysis: Diminishing trading volumes indicate a lack of buying interest, aligning with our bearish outlook.
Please ensure proper risk management by adhering to the provided stop loss and take profit levels. We recommend continuously monitoring the market as unexpected fluctuations can occur.
Stay vigilant and happy trading!
Best regards,
Your Trading Team
Stratis Breaks Ascending Triangle (115%-168% Short-Term Pot.)Stratis (STRAXBTC) hit bottom June 2024 and has been moving with a bullish bias, that is, it has been producing higher lows while at the same time it has been challenging the upper boundary line of a consolidation triangle.
This pair, like many others, is moving strongly bullish as Bitcoin moves bearish. This means that this pair can grow while Bitcoin crashes.
Today Bitcoin is trading at the lowest level in a month, since the 5th of August. This is the continuation of the bearish move that start in March 2024. Such strong bearish action would normally crash the entire market but, since we are entering a major bull-run phase in 2025; smart money, smart traders and smart people alike know best than to sell their Altcoins. They are buying and holding and accumulating in anticipation of this major bullish event.
This is just one of the many Altcoins that are growing and set for growth... Bitcoin will also grow strongly in 2025, but it needs to end its correction before growth can take place.
All is good within the Cryptocurrency market. Money flowing out of Solana, Bitcoin, Ethereum, Binance Coin, Tron and the rest, will flow to the smaller Altcoins, such as this one.
Namaste.

✳️ Stratis Higher Low Can Lead To 222.22% Jump, Fast!Stratis is looking good by all means and this chart is intended to show you the target for the next jump.
This is a short-term move and long-term there can be additional growth.
This 222.22% target can be hit within 30 days, just as it can take a bit longer but it will likely remain within the short-term.
➖ We have a nice higher low.
February 2024 vs October/June 2023.
➖ The RSI is above 50.
➖ Trading volume since March 2023 has been leaning towards the bulls.
All these signals are pointing up.
We expect Stratis (STRAXBTC) to match the signals with price action and grow.
Namaste.

✳️ Stratis ALTSBTC Recovery Confirmation = Bitcoin CorrectionPatience is key...
More than 30 days of a steep decline, a strong correction, has been recovered in a single day.
This is Stratis on its Bitcoin pair (STRAXBTC).
Notice the super high volume and the massive growth today of 45%.
What one does, the rest follows... It is the turn for the Altcoins vs Bitcoin pairs.
Bitcoin will enter its correction, that's ok we've been waiting for it, we can protect our Bitcoins by moving to the Altcoins and enjoy the ride up, once the Altcoins stop moving we switch back to Bitcoin and win-win all across.
We have plenty of time because this process can take weeks... I shared my warning 24-March, see the chart below:
There is still time though.
Namaste.

STRAX-BTC +54% profit 🔥(DONE)🔥STRAX-BTC
BUY: 0.00002560
SELL:0.00003918
PROFIT: 54% DONE✅
congratulations to our team

Stratis (STRAX) formed bullish BAT | A good buy opportunityHi dear friends, hope you are well and welcome to the new trade setup of Stratis ( STRAX ) coin with BTC pair.
Previously we had a nice trade of STRAX with USD pair.
Now on a 4-hr time frame, STRAX has formed a bullish BAT pattern:
Note: Above idea is for educational purpose only. It is advised to diversify and strictly follow the stop loss, and don't get stuck with trade

Stratis 93% Bullish Breakout (Weekly Timeframe | 12,000% To ATH)Stratis (STRAXBTC) breaks bullish today with massive growth.
This is what we are looking for and what we see coming for the Altcoins we are sharing.
Todays candle has grown by 93% as prices break above EMA100, EMA300 and MA200 simultaneously.
Supported be really high volume.
Here is the daily chart:
With a low set 12-May, this type of action can signal a trend reversal...
Growth long-term.
We can see a nice 180%+ since the May low.
Now, looking at the weekly timeframe.
The low was set January this year, 2022 and this May the higher low.
We are mapping 634% to EMA300.
And over 12,000% to Stratis vs Bitcoin All-Time High.
See the chart.
Namaste.

Stratis (STRAX) formed bullish BAT for upto 15.5% moveHi dear friends, hope you are well and welcome to the new trade setup of Stratis ( STRAX ) coin with BTC pair.
On a 2-hr time frame, STRAX has formed bullish BAT pattern.
Note: Above idea is for educational purpose only. It is advised to diversify and strictly follow the stop loss, and don't get stuck with trade


STRAX -some targetsAnother buy signal here into "red zone" but looks promising from a pattern perspective - some cups n handles
What happened Stratis coin?
Stratis announced mid-October 2020
that STRAT tokens will be swapped with STRAX tokens.
This migration is due to a change of blockchain.
As explained on the Stratis website, the STRAT blockchain will be replaced and a new STRAX blockchain will be launched
Stratis is an enterprise blockchain technology company that offers a flexible and modular platform designed for the needs of enterprises.

Stratis: The accumulation phase of a lifetimeStratis has been in accumulation/range bound for more then 800 days at the moment. The risk is very low the reward huge imo.

STRAX/BTC Big move coming dont missStrax consolidating around 4k sats about 2 years and now we are coming to an end for downtrend triangle. In case of upper breakout huge move will come. Don't miss it.

MACD Cross #StraxMACD crosses on the daily timeframe has delivered very good results on #strax in 2021 and is about to cross again. Expecting a 90% to 175% gain in the coming days should the volume arrive

$STRAX Update - still in acc. phase$STRAX
Still in accumulation zone.
But buying at support and selling at resistance still works for some #alts like this one.
Even tho it pumped almost 50% in the past few days, I'm still watching it.
ATH was in '18 at $22, now price is $1.6.

STRAX/BTC - buy it, hold it 1 year, make 40x returnI have no idea, what is the purpose of the cryptocurrency named STRAX, but chart is telling me one thing - big boys are accumulating this coin for 660 days and after they finish their accumulation (it could take another year to complete) they will send it to the moon.

STRAX/BTC Update: Still following the upwards movement Like the whole market Stratis did see a major pullback.
Looking at the chart against Bitcoin we see that we got pulled back near our ascending line (violet).
The first resistance line around 0.000062 was taken out which will make it easier to go through the next time.
Looking at the RSI we see that we get close to oversold regions.
Checking the Fib we recognise that we have to hold the 0.6 line to remain bullish.
If you are interested into more details about Stratis so checkout their twitter page:
twitter.com
You also can ask questions at their AMA on May 25 at 12:00 (EDT).
Basic rules:
- Never buy the top/ATH
- Take profit as long as you can (also partial profit is profit)
- Use Stop/loss for leveraged positions
- If you are not experienced, don't leverage in the first place
Enjoy the ride and don't be too greedy.
If you like the content, please like, comment and give this channel a follow.
We would love it if you could share your thoughts in the comments.
Discussions are very welcome here.
Always do your own research and keep in mind that my charts and comments cannot be considered financial advice.
Cheers
ps.
Chart explanation:
Main lines:
- Green lines are tested support lines.
- Orange lines are resistance lines or, if we are above, possible support lines which were not tested yet.
- Cyan line is for volume trendline.
- White lines are Fibonacci retracement levels
Helplines:
- Purple lines are trendlines we take a look at.
- Yellow lines are for visual help only.
Boxes:
- Either entry zone or support zone. Check the description.

straxbtc vs btcusd daily longthese two charts looks so bullish to me as it we can see it on chart
long on daily

STRAX/BTC Update: Bullish H&S breakout. Upwards we go Stratis did a bullish breakout from the Head and Shoulders pattern.
We even did break the first resistance line and are currently consolidating above it.
If we manage to hold above the old resistance line and turn it into support we can expect further upwards movement.
Checkout the twittersite of stratisplatform which is very active.
Basic rules:
- Never buy the top/ATH
- Take profit as long as you can (also partial profit is profit)
- Use Stop/loss for leveraged positions
- If you are not experienced, don't leverage in the first place
Enjoy the ride and don't be too greedy.
If you like the content, please like, comment and give this channel a follow.
We would love it if you could share your thoughts in the comments.
Discussions are very welcome here.
Always do your own research and keep in mind that my charts and comments cannot be considered financial advice.
Cheers
ps.
Chart explanation:
Main lines:
- Green lines are tested support lines.
- Orange lines are resistance lines or, if we are above, possible support lines which were not tested yet.
- Cyan line is for volume trendline.
- White lines are Fibonacci retracement levels
Helplines:
- Purple lines are trendlines we take a look at.
- Yellow lines are for visual help only.
Boxes:
- Either entry zone or support zone. Check the description.

STRAXBTC again Daily LongI like this coin
as it is showing on charts
targets have not hit yet
after breaking the R long beautiful green candles will see


STRAX/BTC Update: Entry picked, H&S plays out, 50x incomingWe did get our entry shown by the box.
The Head and Shoulders pattern plays out as well and we are likely to see upwards movement.
STRAX did hold very well during this midday pullback which is another bullish sign.
Basic rules:
- Never buy the top/ATH
- Take profit as long as you can (also partial profit is profit)
- Use Stop/loss for leveraged positions
- If you are not experienced, don't leverage in the first place
Enjoy the ride and don't be too greedy.
If you like the content, please like, comment and give this channel a follow.
We would love it if you could share your thoughts in the comments.
Discussions are very welcome here.
Always do your own research and keep in mind that my charts and comments cannot be considered financial advice.
Cheers
ps.
Chart explanation:
Main lines:
- Green lines are tested support lines.
- Orange lines are resistance lines or, if we are above, possible support lines which were not tested yet.
- Cyan line is for volume trendline.
- White lines are Fibonacci retracement levels
Helplines:
- Purple lines are trendlines we take a look at.
- Yellow lines are for visual help only.
Boxes:
- Either entry zone or support zone. Check the description.

