SUI PERPETUAL TRADE , Sold at $2.91SUI PERPETUAL TRADE
SUI SELL SETUP
Currently $2.91
Sold at $2.91
(Trading plan If SUI/USDT up to $3.10 will add more shorts)
Expecting target $2.81 OR DOWN
Incase of early exist will update this anaylsis
Its not a Financial advice
Key stats

UPDATE ON SUI SELL PERPETUAL ,MORE SHORTS FROM $3.40Update on SUI SELL PERPETUAL TRADE
Added more shorts from $3.37 &3.40
Some taking profit points from top
$3.11
$3.02
$2.92
Targeting $2.92-2.89
Its not a Financial advice

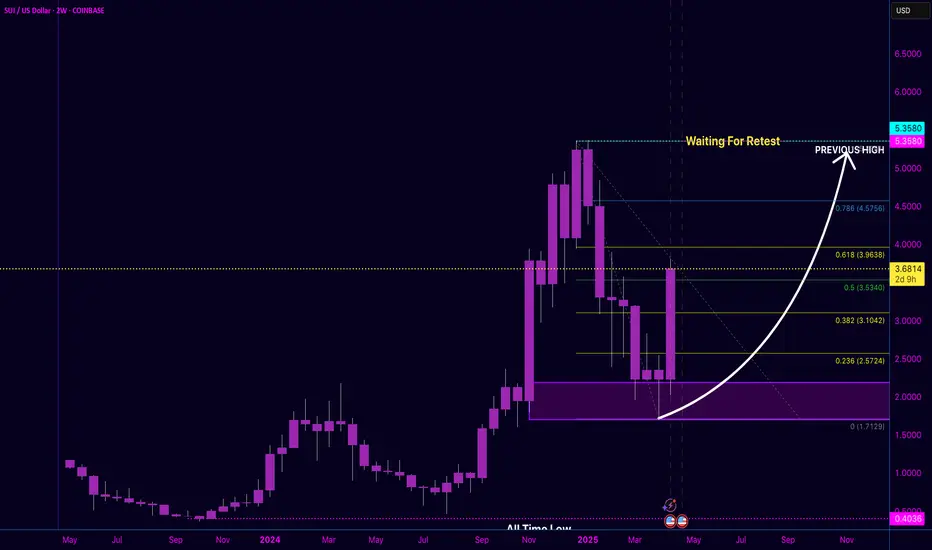
SUI / USD – Weekly Structure Flip in Progress This chart is saying loud and clear:
We may have just printed a bottom.
📈 After bouncing from the All-Time Low Zone, SUI surged with authority, reclaiming the .236 Fib and now eyeing .382 at $3.10+.
What I'm seeing:
✅ Bullish engulfing from demand
📊 Clear Fibonacci levels aligning with volume in
Weekly plan for SUIIn this video I considered the global possible price movement, also made possible scenarios for the current week
Right now the price is between two important levels and there is a chance that the correction will start soon
Write a comment with your coins & hit the like button, and I will make an

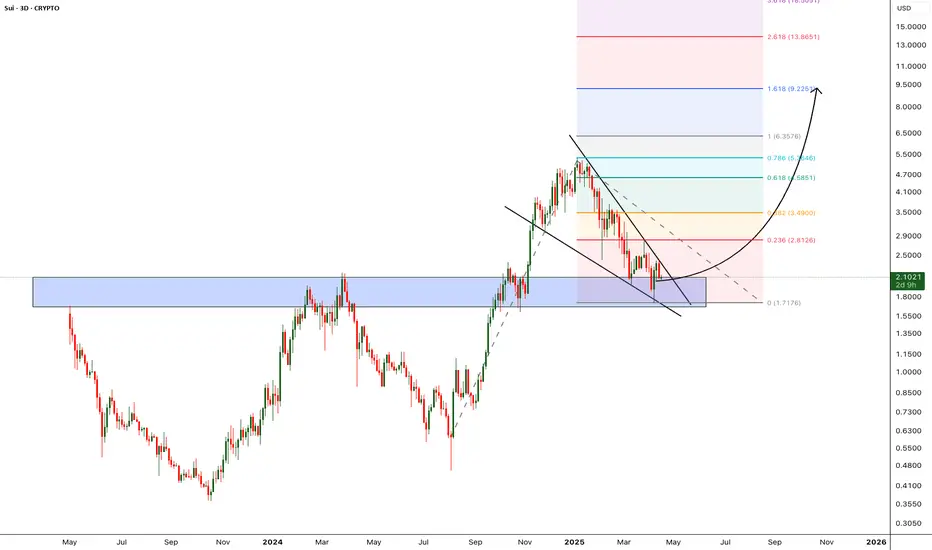
SUI: The Bullish Continuation#Sui led the market during the Aug–Dec 2024 rally. Since then, it has been in a corrective wave (4) within a larger bullish structure. A trend reversal might happen soon to target the ~$10 level.
Passing $3.57 confirms that, while breaking $1.71 would call for reassessment.

SUI - Double Digit is next - Alt season LeaderCorrection of the SUI is over, currently trading around the previous Support zone. i'm expecting this support to hold and bounce back from the support zone.
Once the price breaks from the falling wedge pattern we can expect the bullish momentum to start and hit new all time high.
Entry: after we
SUI has traded back up the the equilibrium zone.As many of us already know, SUI has the ability to make some really big moves very quickly, and it's currently trading at the bottom of the equilibrium zone.
This will be very interesting to watch.
Good luck, and always use a stop-loss!

SUI Trade Setup – Early Reversal PlaySUI has just swept underside liquidity around $1.80, reclaiming key support and showing signs of a potential trend reversal. If it holds this higher low and breaks above $2.40, that would likely confirm a bullish structure shift and open the door for a strong move up.
📍 Entry Zone:
Around $2.25
🎯

SUI STILL SHORT(SELL) FROM THESE LEVELS $3.64-3.80SUI PERPETUAL TRADE
Good short entry levels now ($3.64 - $3.80)
SUI still have room to go down towards
Targeting
$3.37
$3.23
(3.13 & 3.03)
Its not a Financial advice

SUI extremely bullish Marked the important levels in this video for this week and considered a few scenarios of price performance, also in this video I considered the global possible price movement
Important support for this week is the 2.9-3 zone
Write a comment with your coins & hit the like button and I will make an

See all ideas
Summarizing what the indicators are suggesting.
Oscillators
Neutral
SellBuy
Strong sellStrong buy
Strong sellSellNeutralBuyStrong buy
Oscillators
Neutral
SellBuy
Strong sellStrong buy
Strong sellSellNeutralBuyStrong buy
Summary
Neutral
SellBuy
Strong sellStrong buy
Strong sellSellNeutralBuyStrong buy
Summary
Neutral
SellBuy
Strong sellStrong buy
Strong sellSellNeutralBuyStrong buy
Summary
Neutral
SellBuy
Strong sellStrong buy
Strong sellSellNeutralBuyStrong buy
Moving Averages
Neutral
SellBuy
Strong sellStrong buy
Strong sellSellNeutralBuyStrong buy
Moving Averages
Neutral
SellBuy
Strong sellStrong buy
Strong sellSellNeutralBuyStrong buy