SYS looks very bullish (1D)It seems that a diametric pattern has completed, and the price has reclaimed a key level. A pullback to this level is expected to hold as support, potentially leading the price toward higher zones.
The targets are marked on the chart, and as long as the green zone is maintained, a move toward those targets is expected.
A daily candle closing below the invalidation level would invalidate this analysis.
For risk management, please don't forget stop loss and capital management
When we reach the first target, save some profit and then change the stop to entry
Comment if you have any questions
Thank You
SYSUSDT trade ideas

SYSUSDT 1DThe price has approached the dynamic descending trendline while entering the Potential Reversal Zone (PRZ) of the Butterfly harmonic pattern. Given the confluence of technical factors and within the designated time frame marked on the chart, the conditions appear favorable for a potential bullish reversal.

#SYS/USDT#SYS
The price is moving in a descending channel on the 1-hour frame and is adhering to it well and is heading to break it strongly upwards and retest it
We have a bounce from the lower limit of the descending channel, this support is at a price of 0.0474
We have a downtrend on the RSI indicator that is about to break and retest, which supports the rise
We have a trend to stabilize above the moving average 100
Entry price 0.0540
First target 0.0588
Second target 0.0624
Third target 0.0666

SYSSYS is a good trade for now please take the stoploss in consideration because the market is not stable

#SYS/USDT#SYS
The price is moving in a descending channel on the 1-hour frame and is adhering to it well and is heading to break it strongly upwards
We have a bounce from the lower limit of the descending channel, this support is at a price of 0.0583
We have a downtrend on the RSI indicator that is about to be broken, which supports the rise
We have a trend to stabilize above the moving average 100
Entry price 0.0646
First target 0.0732
Second target 0.0800
Third target 0.0905

SYSUSDT Quick Scalp IdeaBINANCE:SYSUSDT Entry Now
SL: 4Hr close below 0.0952
Targets:
🎯 0.1002
🎯 0.1021
🎯 0.1044
Small risk.
Reason: 1 hour timeframe pullback.
Not financial advice, just a quick idea

#SYS (SPOT) IN ( 0.1000- 0.1240) T.(0.6400) SL(0.0940)BINANCE:SYSUSDT
#SYS / USDT
Entry( 0.1000- 0.1240)
SL 1D close below 0.0940
T1 0.1660
T2 0.2600
T3 0.4500
T4 0.6400
2 Extra Targets(optional) in chart, if you like to continue in the trade with making stoploss very high.
______________________________________________________________
Golden Advices.
********************
* collect the coin slowly in the entry range.
* Please calculate your losses before the entry.
* Do not enter any trade you find it not suitable for you.
* No FOMO - No Rush , it is a long journey.
Useful Tags.
****************
My total posts
www.tradingview.com
**********************************************************************************************
#Manta #OMNI #DYM #AI #IO #XAI #ACE #NFP #RAD #WLD #ORDI #BLUR #SUI #VOXEL #AEVO #VITE #APE #RDNT #FLUX #NMR #VANRY #TRB #HBAR #DGB #XEC #ERN #ALT #IO #ACA #HIVE #ASTR #ARDR #PIXEL #LTO #AERGO #SCRT #ATA #HOOK #FLOW #KSM #HFT #MINA #DATA #SC #JOE #RDNT #IQ #CFX #BICO #CTSI #KMD #FXS #DEGO #FORTH #AST #PORTAL #CYBER #RIF #ENJ #ZIL #APT #GALA #STEEM #ONE #LINK #NTRN #COTI #RENDER #ICX #IMX #ALICE #PYR #PORTAL #GRT #GMT #IDEX #NEAR #ICP #ETH #QTUM #VET #QNT #API3 #BURGER #MOVR #SKL #BAND #ETHFI #SAND #IOTX #T #GTC #PDA #GMX #REZ #DUSK #BNX #SPELL #POWR #JOE #TIA #TFUEL #HOT #AVAX #WAXP #OGN #AXS #GALA #ONE #SYS

A 180% move potential on SYS IMO SYS is bottomed out here and most importantly bottomed out on btc pair

SYS USDT reasonably bullish structure1.6 fib extension points to 26 cents which can be a reasonable target for perps of SYS. If ETH continues growing relative to BTC and USD, SYS can potentially go to higher targets

SYS - Beautiful Setup!Dear my friends,
After closing the XRP trade to wait for the next opportunity, I continued searching for coins with favorable entry positions. My attention turned to SYS, a coin I previously shared, where many of you hit target 1. I'm still waiting for a chance to enter for the next target.
This time, everything seems clearer. First, the volume is significantly higher than before—it's distinct and green, much like what we saw with Alpha. When I drew the trendline, something remarkable stood out. It revealed a perfect retest and breakout setup. I then plotted my targets and began waiting.
It's rare to come across such a beautiful setup—truly rare!
Best Regards,

Bullish Continuation for SYS USDT on the cardsSYS has maintained its freshly claimed levels of 0.17-0.18 cents and has consolidated at these levels even with RSI cooling off, suggesting little if any sell-offs. Given the coin's history dating back to 2014, it is feasible to assume that vast quantities of coin are lost and the remaining community may be diamond handed. Despite doing a 2x no sell volume. Next target around 0.29 cents where we reassess.

SYS | Another Old School CoinSince all oldschool coins are pumping right now, Syscoin might be another good one for quick gains. Just remember this is only for short-term trading - don't hold these coins for long.

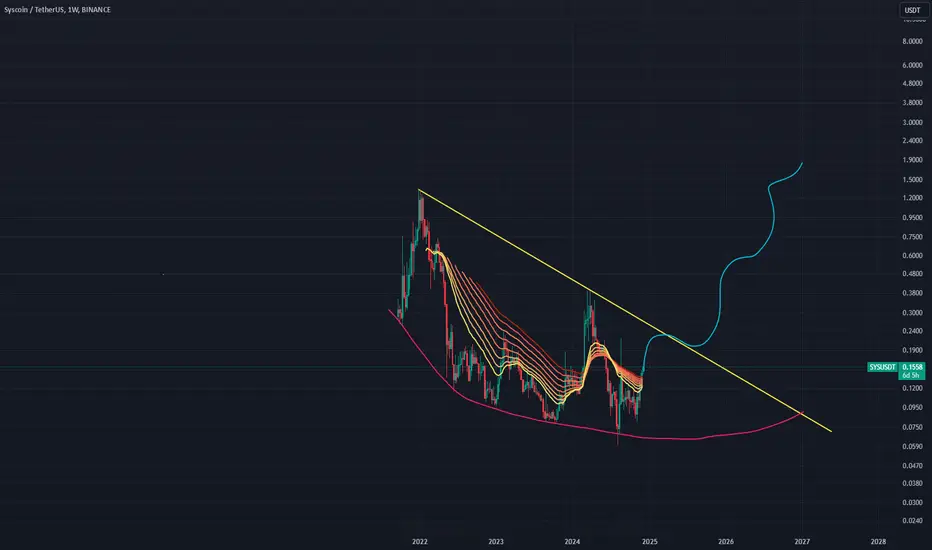
SYS USDT parabolic growth approachingSYS USDT pair are entering a parabolic growth stage. Upward movement can be violent and reach its prior ATH at 1.35 USD after which SYS can head into price discovery
SPOT SYS LONG 27.11.2024🎯Purpose:
0,1773
‼️We enter at 0.5% of the allocated money for spot trading.

Syscoin UpdateSyscoin initial bullish breakout was explosive. This pair, SYSUSDT, grew more than 265% in a matter of days after the early August bottom low. This initial breakout produced a correction and this correction ended in a higher low. In this higher low territory consolidation was taking place. We can say the consolidation is over because Syscoin is now moving above MA200 on the daily timeframe.
A new jump will produce a new high compared to August 19. That is because we have a higher low and higher lows lead to higher highs, and, of course, the Cryptocurrency market right now is ultra-bullish.
This opens up a new question: How far up will it go?
Long-term, it will go really, really high, but short-term, the next target can be seen on the chart.
I would say around 0.5800.
This is a quick and simple update.
Thank you for reading.
Namaste.

SPOT SYS LONG 24.11.2024🎯Purpose:
0,1476
‼️We enter at 0.5% of the allocated money for spot trading.

Trading opportunity for SYSUSDTBased on technical factors there is a Buy position in :
📊 SYSUSDT
🔵 Buy Now
🪫Stop loss 0.1000
🔋Target 1 0.1500
🔋Target 2 0.2000
🔋Target 3 0.2500
💸RISK : 1%
We hope it is profitable for you ❤️
Please support our activity with your likes👍 and comments📝

SYS Gold Buy opportunity, same Cycle with 0.22XX is loading SYSCOIN (SYS) has recently experienced a bounce from the bottom, but it's important to be cautious about its future direction.
Key Technical Analysis:
* Fakeout: The last pump was above the $0.117X level could be considered a fakeout, as the price has since retraced to the $.0970 Monthly support level.
* Potential Correction: A deeper correction towards the 0.08XX support levels is possible.
Remember:
* Do Your Own Research: Always conduct thorough research before making any investment decisions.
* Risk Management: Use stop-loss orders to protect your investments from potential losses.
* Diversification: Spread your investments across different assets to reduce risk.
Stay tuned for more updates on Radicle and other cryptocurrencies!
Disclaimer: This is not financial advice. Please do your own research before making any investment decisions.
TRY TO HAVE AN ADVENTAGE And DCA from here

Trade Signal for SYSUSDTAttention traders! A new trade opportunity has been identified for SYSUSDT, presenting a potential sell position. Please find the details of this recommendation below:
Direction: Sell
Enter Price: 0.1063
Take Profit: 0.10146667
Stop Loss: 0.11166667
This trade signal has been generated using the EASY Quantum Ai strategy, which leverages advanced algorithms to analyze historical price data, market trends, and volatility patterns. Our analysis shows a bearish trend forming in SYSUSDT, driven by a confluence of market factors.
The primary factor supporting this forecast is a significant resistance level observed around the current market range. The resistance suggests a likely downturn as the price tests this level. Additionally, momentum indicators such as the Relative Strength Index (RSI) and Moving Average Convergence Divergence (MACD) are signaling overbought conditions, indicating a potential price reversal.
Finally, our analysis includes recent market sentiment and macroeconomic conditions that may exert downward pressure on this pair, further supporting a decrease in price.
As always, ensure you conduct your own due diligence and align this signal with your risk tolerance and trading strategy. Happy trading!

#SYS/USDT is heading towards the Diagonal Trendline in 1-Hour TF#SYS/USDT is heading towards the Diagonal Trendline in 1-Hour TF!
MIL:SYS needs to clear the Trendline to turn bullish. The local resistance level is PWH $0.1054 and the support level is PWL $0.0947.


SYS buy/long setupWe have a bullish QM on the chart. Bullish QM features are well observed on the chart.
By maintaining the green range, it can move towards the targets.
Closing a daily candle below the invalidation level will violate the analysis
For risk management, please don't forget stop loss and capital management
When we reach the first target, save some profit and then change the stop to entry
Comment if you have any questions
Thank You

SYSUSDT Buy opportunitySYS/USDT is showing a strong megaphone pattern, with the price currently testing the support level, making this a potential accumulation zone for a long position. Following the profit path outlined on the chart is advisable, but be aware that this formation could break in either direction depending on the overall market conditions.
A stop-loss is recommended—trade cautiously.
